that an Ashkenazi parent is a carrier is 0.03. The
probability that both parents are carriers is 0.0009
and the probability of an affected child is 0.25 times
0.0009, which equals 0.000225.
If a parent has a positive family history, the
probability of the individual being a carrier can be
calculated according to Mendelian and Bayesian
formulas. Say that a mother has a brother with
hemophilia, an X-linked disorder. That means that
her mother is an obligate carrier and that the Mende-
lian probability that she is a carrier is 0.5. An
obligate carrier is an individual who can be deduced
to be heterozygous from the family history. Another
example of an obligate carrier is the daughter of a
man with hemophilia. If the couple already has
disease-free children, this additional information
about the likelihood of carrier status can be incorpo-
rated into the calculation of the probability of being
a carrier. If there are two disease-free boys, the
probability is 0.2. Using Bayes’ formula,
probability of being a carrier =
0.5
%
0.25
0.5
%
0.25
+ (
1
−
0.5
)
%
1
=
0.2
where 0.5 is the prior probability of the mother
being a carrier, 0.25 is the probability of having two
disease-free sons if the mother is a carrier, and 1 is
the probability of having two disease-free sons if the
mother is homozygous for the normal gene. The
probability estimate can be refined further by
measuring the plasma concentration of factor VIII in
the mother. Factor VIII is the deficient coagulation
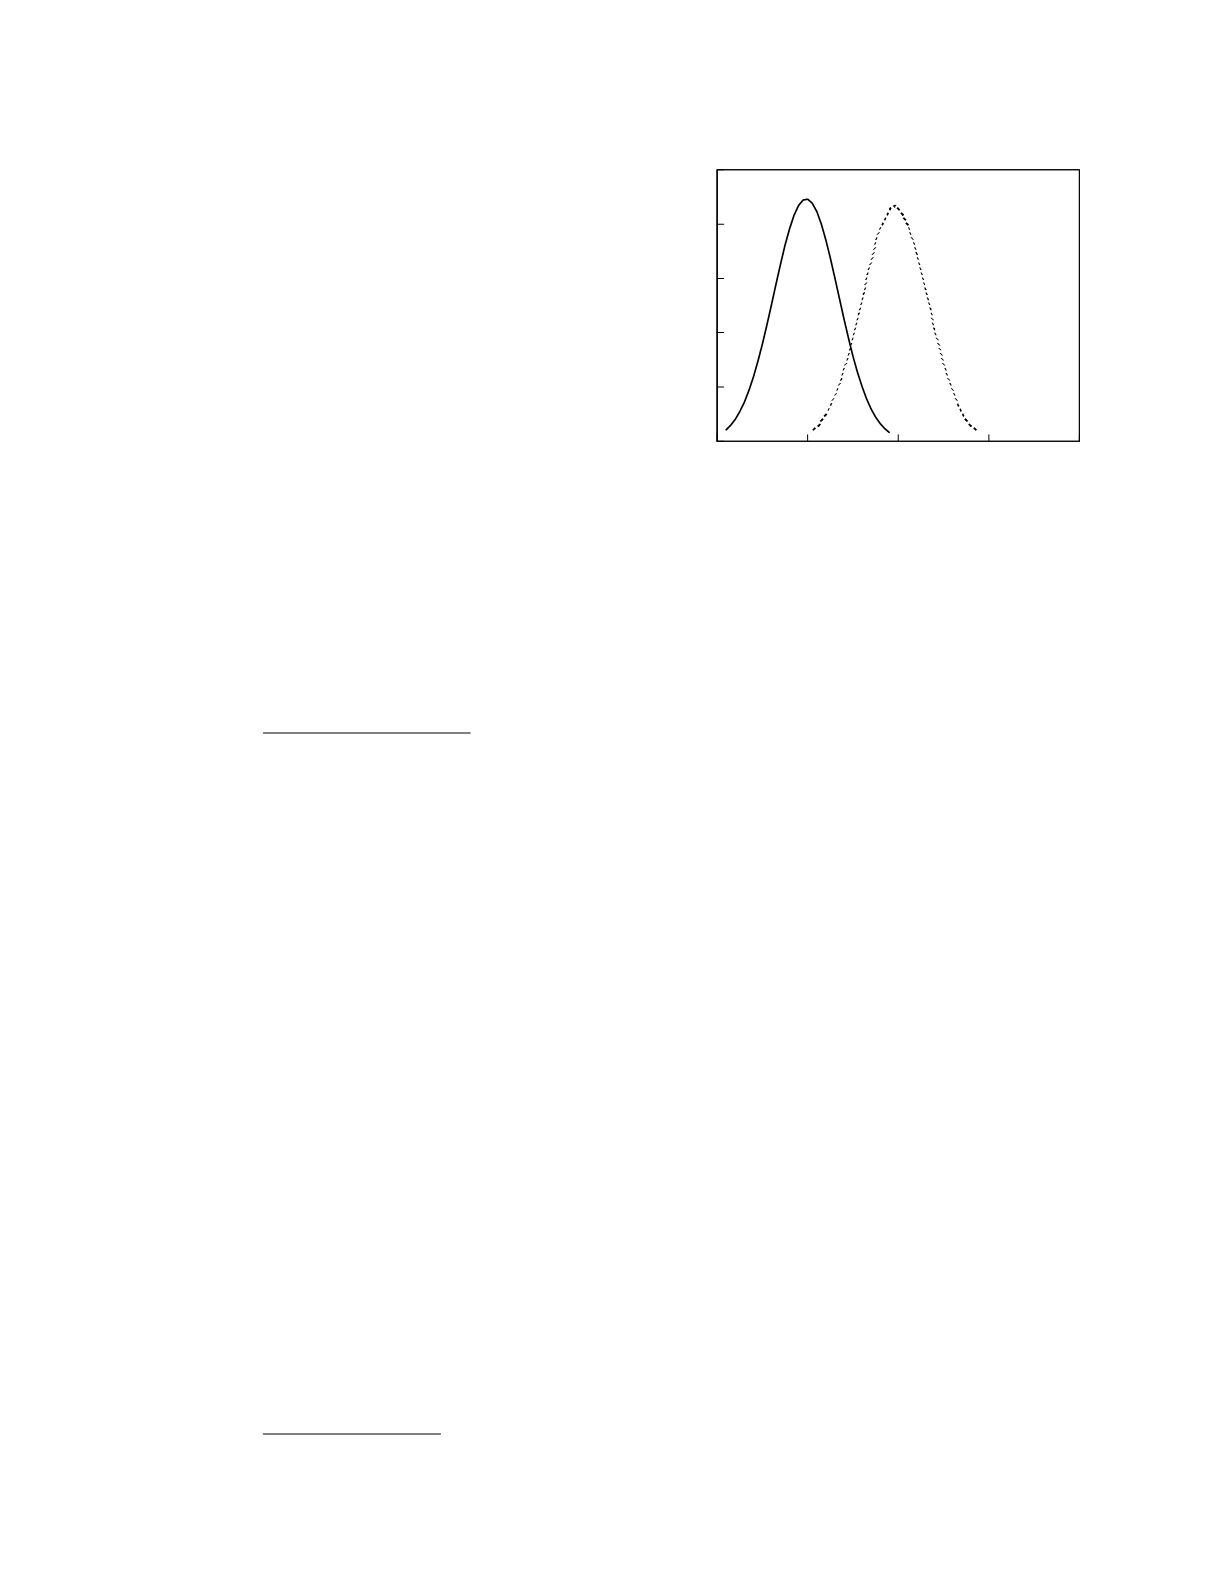
factor in hemophilia. Carriers of hemophilia secrete
half as much factor VIII into the circulation so that
their plasma factor VIII concentrations are, on
average, only half normal. The frequency distribu-
tions for factor VIII derived from the data reported
by Duncan
et al.
(1984) are shown in Figure 10.7.
In this figure, the separation between the two
diagnostic classes has been improved by correcting
for the effect of von Willebrand factor concentration
upon the plasma factor VIII concentration (Noe
1996). Likelihood ratios for carrier status can be
calculated from the data depicted in the figure. For
instance, at a corrected factor VIII concentration of
0.9 U/ml, the likelihood ratio for being a carrier is
approximately 0.08. Using Bayes’ formula,
probability of being a carrier =
0.2
%
0.08
0.2
%
0.08
+ (
1
−
0.2
) =
0.02
This means that the probability that the mother will
have an affected son is 0.01.
The utility of a phenotypic marker as a tool for
carrier identification is assessed by determining how
well it performs in classifying parents according to
their correct phenotype. As discussed in Chapter 3,
the index of classification accuracy that is most often
used is the area under the ROC curve. The area
under the ROC curve for corrected plasma factor
VIII concentration as a marker of being a carrier of
hemophilia is 0.97. This is quite high remembering
that an ideal study has an area of 1. Still, it does not
mean that the study can provide the desired degree
of diagnostic certainty in any specific case.
Consider, for example, a mother who wants to know
that the probability of her son having hemophilia
will be less than 0.001. If her prior probability of
being a carrier is 0.5 (say her brother has hemophilia
and she has no children yet), she can be assured of
the stipulated low risk of bearing an affected son
only if her corrected plasma factor VIII concentra-
tion is 1.15 U/ml or more. At lower factor VIII
concentrations her probability of being a carrier is
greater than 0.002 so the probability of an affected
son is more than 0.001. If she has a normal
genotype, the probability she will have a corrected
factor VIII concentration greater than 1.15 U/ml is
only 0.17. So the chances that the factor VIII
measurement will provide her the confidence to bear
a son is quite low.
Instead of inferring the genotype using a pheno-
typic marker, most of which are subject to diagnostic
uncertainty, the genotype can be evaluated directly
Genetic Disease
10-13
0
0.5
1
1.5
2
Corrected factor VIII concentration (U/ml)
0
0.5
1
1.5
2
2.5
Frequency
carriers normal
Figure 10.7
Reference frequency distributions for
corrected plasma factor VIII concentration. The distribu-
tions are derived from normal distribution models of the
data reported by Duncan
et al.
(1984).


