tissue. The point of intersection of the two curves
defines the state of the target process at which the
magnitude of the effector and feedback signals are
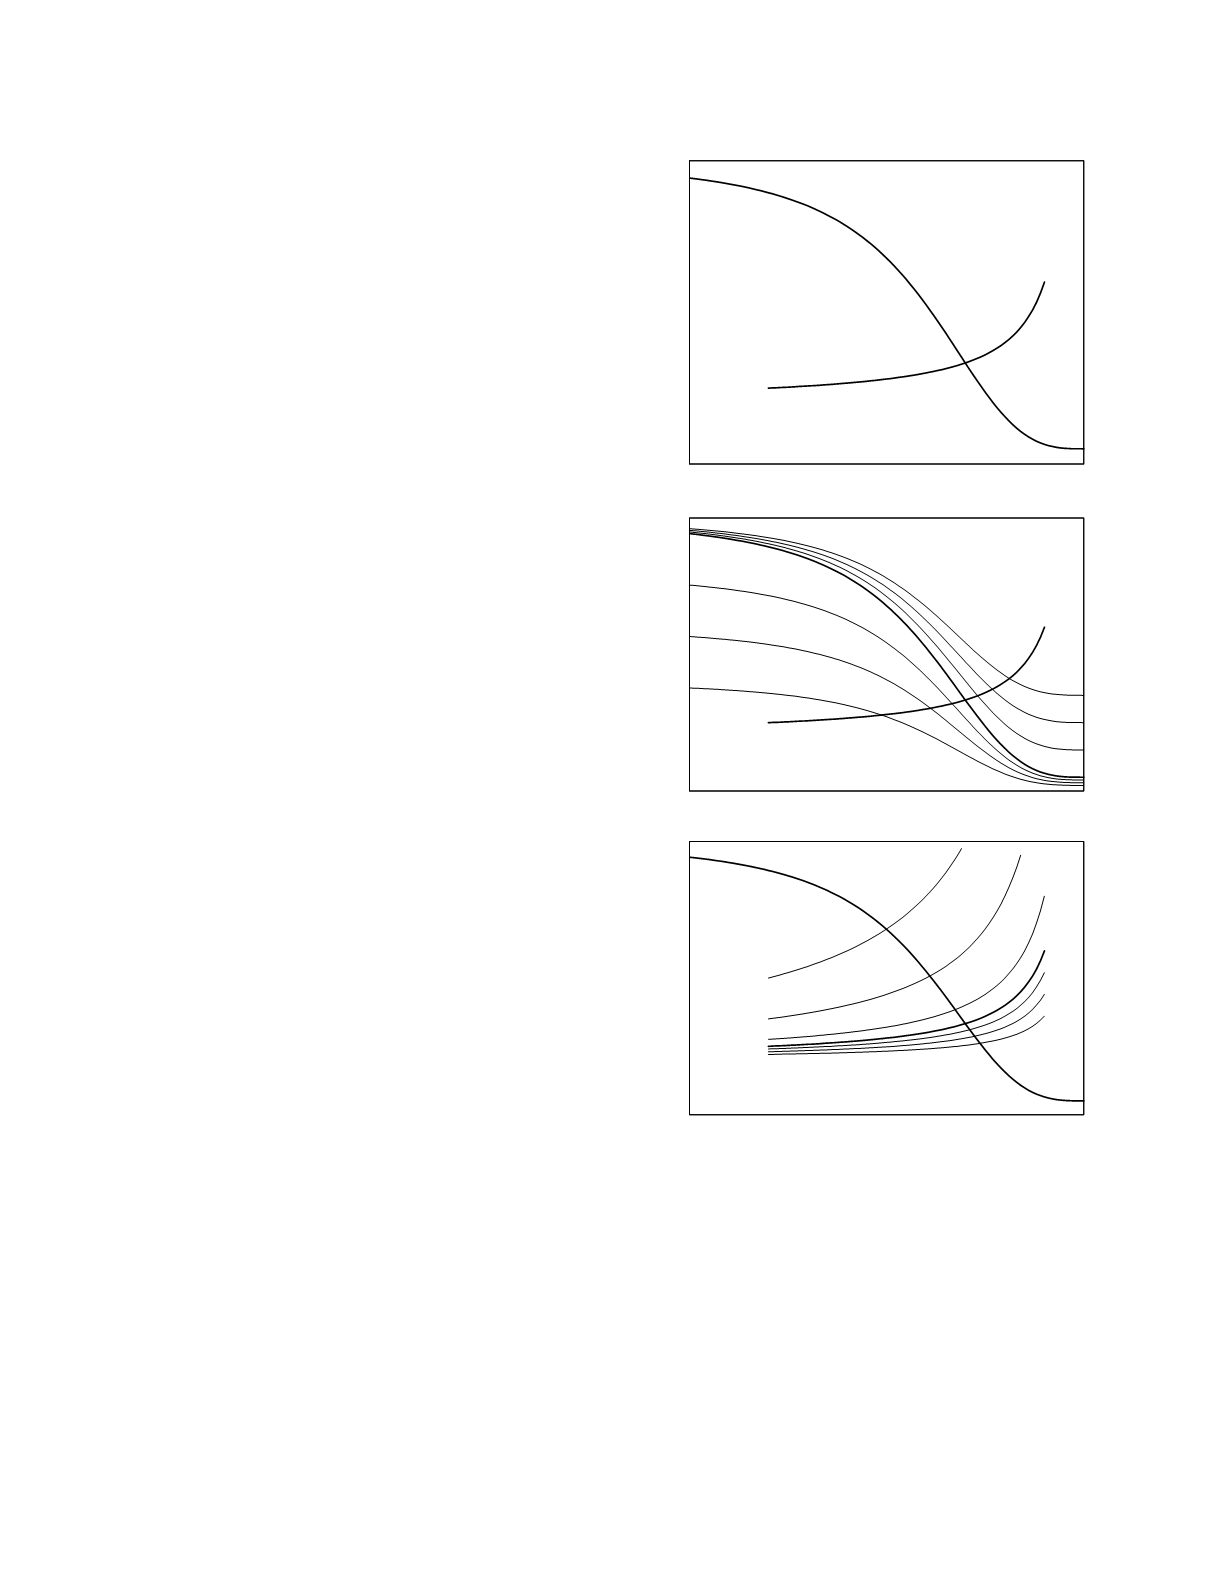
exactly in balance. Panel A of Figure 7.7 shows a
pair of control and effect response curves similar to
those of the parathyroid hormone-calcium regulatory
system. The control response curve shows the
magnitude of the effector signal that results from the
indicated levels of the feedback signal. When the
feedback signal is small, the effector tissue produces
a strong signal, when the feedback signal is large,
the effector signal is small. The effect response
curve relates the state of the target process, as
measured by its feedback signal, to the magnitude of
the effector signal. At low levels of the effector
signal, the target process is suppressed and the
feedback signal is small; when the effector signal is
large, the target process is stimulated and the
feedback signal is large. Only at the point of inter-
section of the two curves are the magnitudes of the
effector and feedback signals in balance. If the
target process is in any other state than the one
defined by this equilibrium position, the imbalance
between the effector signal and the feedback signal
will lead to adjustment of the process toward
equilibrium.
Abnormal function of a regulator tissue may be
due to a disorder of the tissue itself, in which case
the dysfunction is referred to as primary, to a disor-
der of the effector tissue, in which case the dysfunc-
tion is called secondary, or to concomitant
malfunction of both tissues (Turner
et al.
1987). In
terms of the equilibrium model of homeostasis,
primary disorders of homeostasis are those in which
there is an alteration in the location of the control
response curve. As shown in panel B of Figure 7.7,
displacement of the control response curve away
from normal will result in the establishment of an
abnormal homeostatic set-point. The functional
status of both the regulator tissue and the target
process will be similarly perturbed, both being either
increased (primary hyperfunction) or decreased
(primary hypofunction). Secondary disorders of
homeostasis are those caused by an alteration in the
location of the effect response curve (panel C,
Figure 7.7). The abnormal homeostatic set-points in
these conditions are characterized by divergence of
the functional status of the regulator tissue and the
target process. Secondary hyperfunction of the
regulator tissue is associated with a decreased level
of activity of the target process due to hypofunction
of the effector tissue. Secondary hypofunction of the
regulator tissue shows an increased level of activity
of the target process due to hyperfunction of the
effector tissue.
Organ Function
7-7
Feedback signal
Effector signal
control
response
curve
effect
response
curve
Feedback signal
Effector signal
Feedback signal
Effector signal
primary
hyperfunction
primary
hypofunction
secondary
hyperfunction
secondary
hypofunction
Figure 7.7
The equilibrium model of homeostatic control.
The top grpah shows the normal control response curve for
the regulator tissue and effect response curve for the
associated effector tissue. The middle graph depicts
primary dysfunction of the regulator tissue; the control
response curve is displaced from its normal location. The
bottom graph depicts secondary dysfunction of the regulator
tissue; the effect response curve is displaced from its
normal location.


