threshold likelihood ratio for followup =
(
1
−
prevalence
)
P
[
rejection
]
prevalence
(
1
−
P
[
rejection
])
where
prevalence
is the frequency of the genetic
disease in the clinical population and
P[rejection]
is
the level of diagnostic probability at which the
disease is so unlikely that it can be excluded. The
second criterion is that the sensitivity of the study at
the stipulated critical value must be large enough to
justify the expense and inconvenience of the screen-
ing program.
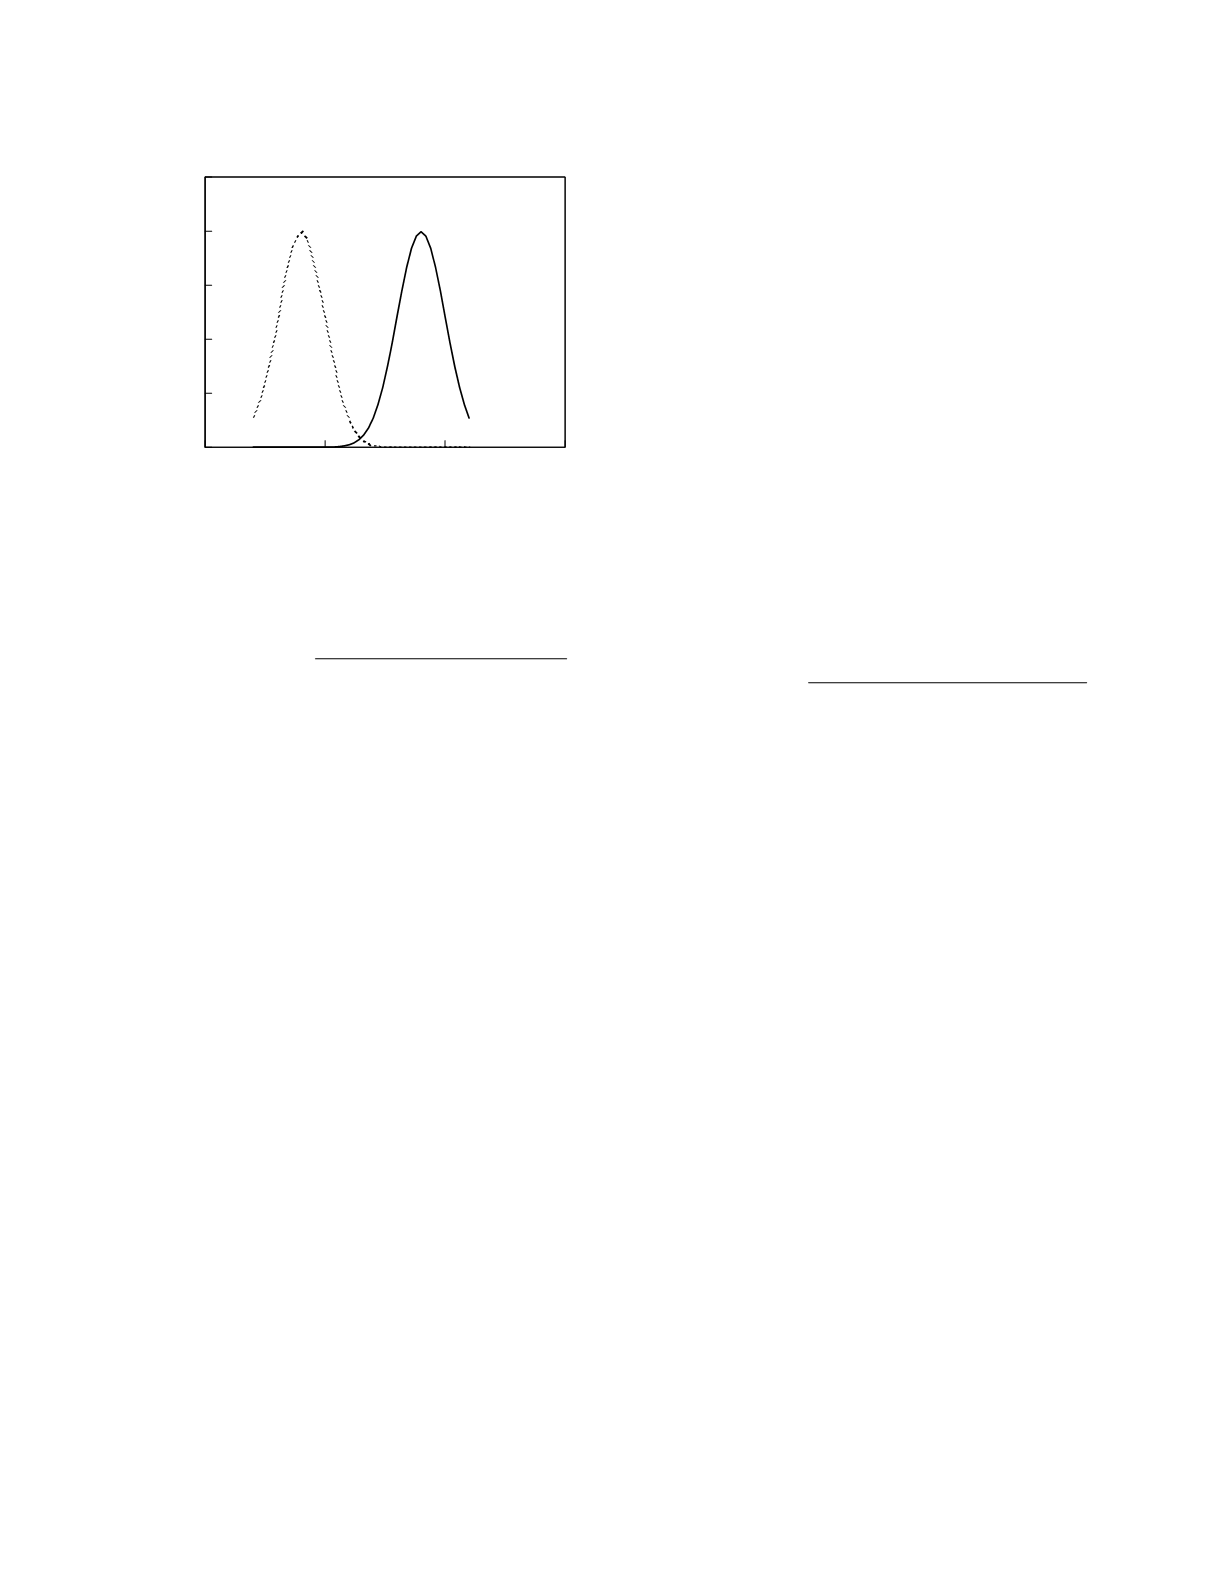
As an example, consider a candidate screening
study with the diagnostic performance illustrated in
Figure 10.6. If a sensitivity of 0.90 is considered
necessary for the screening program, the maximum
critical value that can be used is 3.72 µmol/L as this
is the result value at which the sensitivity just equals
0.90. If the prevalence of the genetic disorder is 1
in 200,000 and if the threshold probability for rejec-
tion P[rejection] is 0.02, the threshold likelihood
ratio for followup is 4082. Likelihood ratios of this
magnitude are only achieved at study concentrations
greater than 4.16 µmol/L. As this value is larger
than the maximum critical value permitted by the
program sensitivity criterion, the performance of the
candidate study falls short of that needed. If,
however, there is a subpopulation that is at risk for
the genetic disorder, the increased prevalence in that
group could still justify the limited use of the study.
For a subpopulation in which the prevalence of the
disorder is 1 in 10,000, for instance, the threshold
likelihood ratio for followup is 204. If the diagnos-
tic performance of the study is the same in the
subpopulation as in the general population, likeli-
hood ratios as large as 204 are found at concentra-
tions greater than 3.56 µmol/L. Here the threshold
likelihood criterion can be achieved while at the
same time satisfying the program sensitivity
criterion. Therefore, the candidate study could be
used to screen for the genetic disorder among
members of the subpopulation.
Use of the threshold likelihood for followup as a
criterion of study performance has as an implicit
assumption that facilities are available for the
diagnostic followup of screen-positive newborns. If
followup is difficult or unavailable, the diagnostic
performance of the screening study has to be good
enough that it can serve as a confirming study. In
that case, screen-positive study results must have
likelihood ratios that exceed the threshold likelihood
ratio for acceptance,
threshold likelihood ratio for acceptance =
(
1
−
prevalence
)
P
[
acceptance
]
prevalence
(
1
−
P
[
acceptance
])
where
P[acceptance]
is the level of probability at
which the disease is so likely that it is deemed
confirmed.
Newborn screening
There are a number of serious genetic disorders
of metabolism that can be significantly ameliorated if
treatment is begun soon after birth (Treacy
et al.
1995). All of these disorders are potential candi-
dates for inclusion in a newborn screening program.
Congenital
adrenal
hyperplasia
due
to
21-hydroxylase deficiency is one such disorder. The
aldosterone deficiency seen in severe forms of the
disease can be treated by replacement therapy with a
mineralocorticoid and the cortisol deficiency can be
rectified by glucocorticoid replacement therapy.
Cortisol therapy also leads to normalization of the
pituitary-adrenal homeostatic axis, thereby reducing
the hypersecretion of androgens. Besides being
treatable, severe congenital adrenal hyperplasia due
to 21-hydroxylase deficiency occurs with a fairly
high incidence—1 in 10 to 15,000 births—therefore
making it an excellent disorder to consider screening
for in the newborn period. As discussed earlier in
this chapter, there is a pronounced elevation in the
plasma concentration of 17-hydroxyprogesterone in
the severe forms of 21-hydroxylase deficiency. The
concentration is almost always more than 20 ng/ml
while the concentration in healthy newborns is less
Genetic Disease
10-11
0
5
10
15
Concentration (µmol/L)
0
0.1
0.2
0.3
0.4
0.5
Frequency
normal
with disorder
Figure 10.6
Reference frequency distributions for a
hypothetical candidate screening study.


