concentration is 0.95. Clearly, it would be better if
the screening performance for PSA concentration
were more like the performance of ferritin
concentration.
One way to improve the discriminatory power of
a screening marker is to reduce the preanalytic and
analytic components of the variability in the
measurement of the marker. In the case of PSA
concentration, preanalytic variability could be
reduced, for example, by stipulating that blood
specimens be obtained only after a 2 day abstinence
from sexual activity, as ejaculation is associated with
a 24-hour elevation in plasma PSA concentration
(Simak et al. 1993). Because digital rectal examina-
tion can sometimes raise the plasma PSA concentra-
tion (Bruel et al. 1992), it is already recommended
that blood specimens be drawn before the physical
examination. There are many ways to reduce the
analytic variability of a laboratory study, but the
most important way is to use a more specific
method of measurement. Immunoassays are used to
measure PSA concentration. Some of the available
assays utilize polyclonal antibodies which can be
expected to recognize various epitopes on the PSA
molecule. Standardization in terms of utilizing
monoclonal antibodies to a single epitope could
reduce analytic variability and improve inter-
laboratory transportability of study results (Stenman
et al. 1995).
Another way to improve screening performance
is to take account of known sources of biologic
variability in the measurement of the screening
marker. As discussed in Chapter 6, such sources of
variability typically include gender, age, and race.
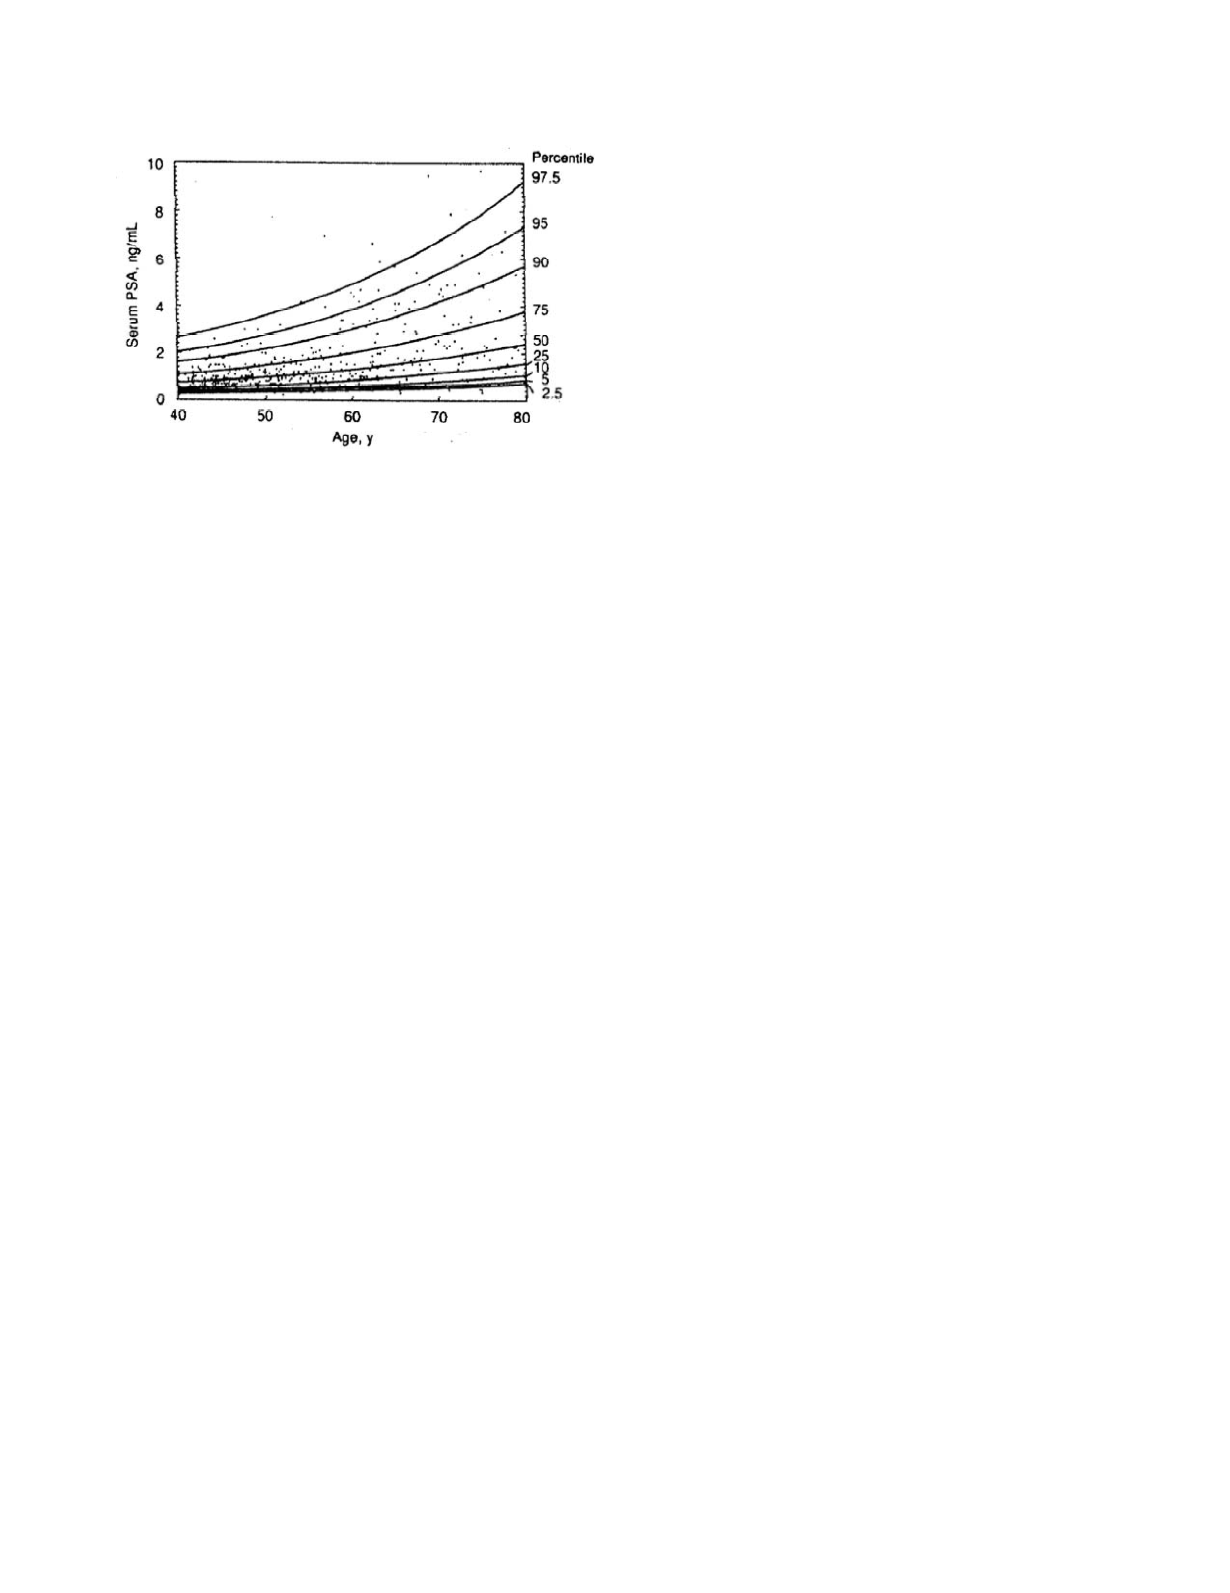
Age has been shown to contribute to the variability
of PSA concentrations. Figure 11.6 shows the fre-
quency distribution for PSA concentration as a
function of age, as modeled by Oesterling
et al.
(1993). The frequency distribution shifts rightward,
i.e., toward higher values of PSA concentration,
with increasing age. Much of this age effect is due
to an increase in prostate size in men over the age of
55 years; the increase being attributable to progres-
sive BPH (Collins
et al
. 1993). However, there is
also an independent contribution of age alone
(Oesterling
et al.
1993, Collins
et al.
1993).
The frequency distribution of PSA concentration
in patients with prostate cancer also shifts rightward
with increasing age. The magnitudes of the right-
ward shifts of the two distributions are nearly equal.
Consequently, the separation between the two distri-
butions remains constant and the ROC curve for
screening for prostate cancer using PSA concentra-
tion retains roughly the same shape and area under
the curve (Catalona et al. 1994b). Note, however,
that the PSA values associated with given points on
the ROC curve change with increasing age. For
instance, Catalona
et al.
(1994b) found that the
sensitivity and specificity achieved with a PSA
concentration of 4.0 µg/L in men aged 50 to 59 are
approximately 0.75 and 0.65, respectively. In men
aged 60 to 69, this screening performance is found
with a PSA concentration of 4.5 µg/L, and in men
70 years and older with a PSA concentration of 5.0
µg/L.
The age-specific frequency distributions shown
in Figure 11.6 were derived from a population of
white males living in Minnesota. Race is another
source of biologic variability in PSA concentration,
so the distributions cannot be applied to men of other
races. In particular, on a decade-by-decade basis,
median PSA concentrations in black men are compa-
rable to those in white men, but the upper limits of
the normal range are much higher in black men
(Morgan
et al.
1996).
A more explicit way in which to account for the
contribution of hyperplastic prostate tissue to the
plasma PSA concentration is to adjust for the size of
the prostate. Prostate volume can be measured clini-
cally by transrectal ultrasound. The method is
relatively easy to perform but unfortunately suffers
from appreciable measurement variability (Catalona
et al.
1994a). Figure 11.7 shows the reference range
Cancer
11-10
Figure 11.6
Plasma PSA concentration as a function of
age. The dots represent the observed data. The lines are
contours of the frequency distribution as calculated based
on a lognormal statistical model of PSA values. Reprinted
Oesterling JE, Jacobsen SJ, Chute CG, Guess HA, Girman
CJ, Panser LA, and Lieber MM. 1993. Serum prostate-
specific antigen in a community-based population of healthy
men. JAMA 270:860.


