using the coefficients and exponents of a polyexpo-
nential equation fit to the disposition data (Wagner
1976). This can be done for oral drugs as well as
drugs administered intravascularly because the
plasma disposition curves of most oral drugs can be
well described with a bi- or triexponential equation.
When estimating kinetic parameter values for
oral drugs, values are derived for the hybrid parame-
ters, V
o
/F and Cl/F, not for the primary parameters,
V
o
, Cl, and F. Fortunately, this is not a problem
because V
o
/F and Cl/F are the terms used in the dose
individualization formulas.
There are two alternative approaches to estimat-
ing the values of individual kinetic parameters that
are based on limited blood sampling schemes. The
parameter values calculated by these approaches are
somewhat less reliable than those derived from
intensive blood sampling but the approaches are
generally much more practicable in the clinical
setting. In the first approach, the parameter values
are calculated using multiple regression equations
where the independent variable values are the plasma
drug concentrations measured at a limited number of
specific time points following the administration of
drug. The equations are based on the statistical
relationship between the parameter values and the
stipulated plasma drug concentrations as found from
the drug disposition curves of a large number of
patients.
In the second approach, kinetic parameter values
are estimated by Bayesian forecasting techniques
(Grasela 1995). Bayesian forecasting involves the
balancing of two sources of information regarding
the parameter values in an individual. The first
source is the frequency distribution of the parameter
values in the clinical population to which the individ-
ual belongs, as derived from an in-depth pharma-
cokinetic study of that population. The second
source is the set of plasma drug concentrations
measured in the individual.
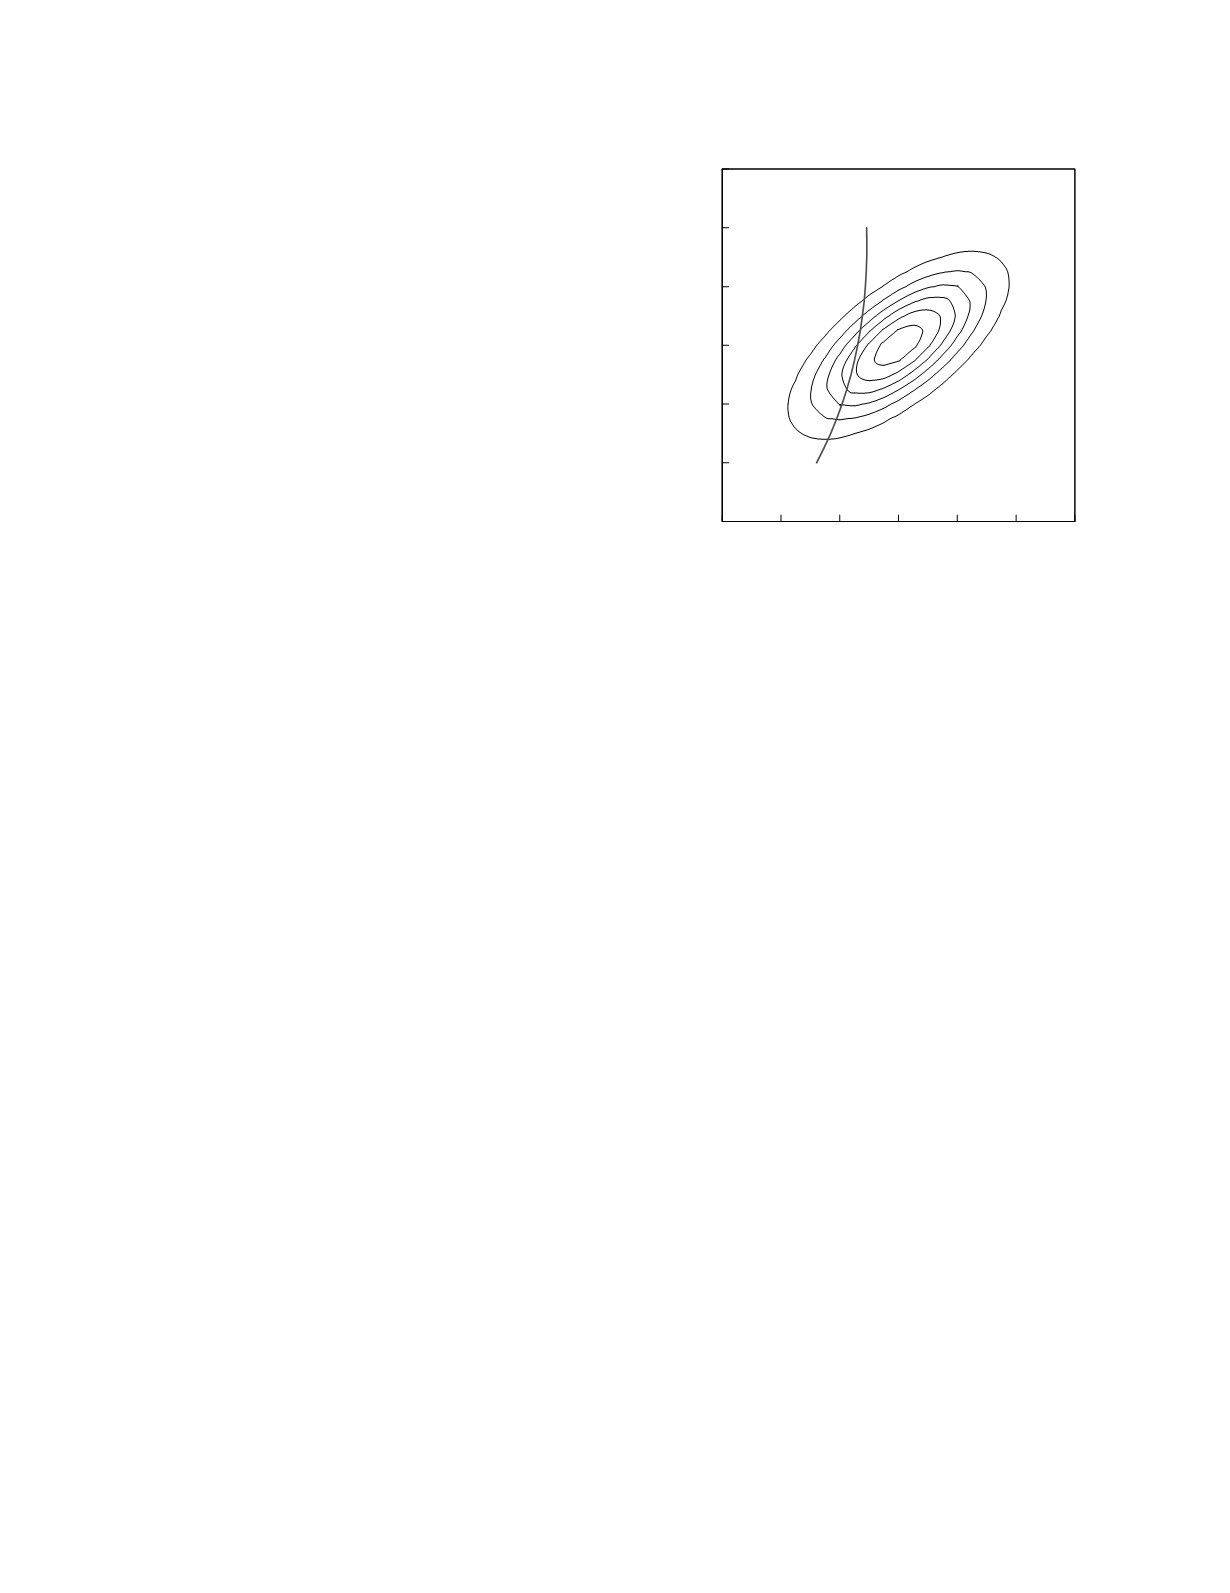
To see what is meant by “balancing” these
sources of information, consider a patient in whom a
plasma drug concentration of 55 µg/ml is measured
1.5 h after the intravascular injection of a 1 g dose
of the drug. If the drug does not have a slow distri-
bution phase, its plasma kinetics can be described by
the two parameters, the initial volume of distribution
and the clearance rate. Paired values of these
parameters that will yield the observed drug concen-
tration are shown in Figure 12.9 as a curved line
segment. Which of these pairs is most likely to
apply to the patient? That is determined by refer-
ence to the joint frequency distribution of the
parameters, also shown in Figure 12.9. The pair of
parameter pair values likely to apply to the patient is
the pair that is most frequently found in the popula-
tion. In this example, that parameter pair is identi-
fied as the point touching the second contour line:
initial volume of distribution, 4.75 L and clearance
rate, 4.25 L/h.
Continuing the example, if a second drug con-
centration is measured using a blood specimen taken
soon after the injection of drug, the two concentra-
tions will uniquely determine the values of the two
kinetic parameters and the population information
will not be contributory. Say the drug concentration
is measured at 0.25 h as well as 1.5 h and its value
is 170 µg/ml. The single pair of parameter values,
initial volume of distribution of 4.69 L and clearance
rate of 4.24 L/h, yields the observed drug concentra-
tions. Regardless of how frequent that parameter
pair is in the population, it is the only one that fits
the data.
This illustrates that the contribution of popula-
tion information to the Bayesian forecast decreases
as the number of drug concentration measurements
increases. However, the contribution is never really
zero, as in the example, because in real life there is
always variability in the measurement of drug
concentrations and therefore also in the calculation
Drug Therapy
12-11
Figure 12.9
Contour plot of the joint frequency distribution
of clearance rate and initial volume of distribution for a
hypothetical drug (concentric ellipses) and the plot of paired
parameter values that yield a observed plasma drug
concentration in an individual (curved line segment).
2
3
4
5
6
7
8
Clearance rate (L/h)
2
3
4
5
6
7
8
Initial volume of distribution (L)


