clinical response is achieved in a patient, the practi-
tioner will sometimes have to individualize the usual
dosing regimen.
Plasma kinetic variability.
Interindividual
variability in plasma drug kinetics is usually large,
with up to 5-fold ranges in the values of the kinetic
parameters. Sources of normal interindividual vari-
ability include inheritance (Guttendorf and Wedlund
1992), sex (Harris
et al.
1995), race (Johnson 1997),
and age (Dawling and Crome 1989, Kinirons and
Crome 1997). Body size can also be a source of
interindividual variability. This is especially true in
children in whom volume of distribution and clear-
ance rate tend to vary in proportion to body size.
Inheritance is a particularly important source of
interindividual variability. Indeed, genetic differ-
ences in drug clearance rate can be so large as to
result in distinguishable subpopulations, called
polymorphisms. The classic example of this are the
slow and fast acetylators of isoniazid. Isoniazid
clearance rate is determined by the activity of
hepatic N-acetyltransferase. Slow acetylators are
homozygous for the slow form of the enzyme while
fast acetylators are either homozygous or heterozy-
gous for the fast form of the enzyme.
Sources of intraindividual variability in plasma
drug kinetics (i.e., variability over time in the same
individual) include pregnancy (Loebstein
et al.
1997), diet (Williams
et al.
1996), biologic rhythms
(Bruguerolle 1998, Kashuba and Nafziger 1998),
and the intake of other drugs.
Inter- and intraindividual plasma kinetic variabil-
ity also arise from the presence and variable severity
of disease processes and as a result of combination
drug therapy. The magnitude of the variability
caused by disease is large, encompassing as it does
the full range of kinetic parameter values that are
physiologically possible. Liver disease may reduce
hepatic drug clearance. Heart failure and severe ill-
ness usually result in a decline in hepatic drug clear-
ance due to decreased hepatic perfusion. Renal drug
clearance is decreased by kidney disease and by
severe illness. Oral drug bioavailability is variably
affected by gastrointestinal disease and is increased
in liver disease due to a smaller first-pass effect.
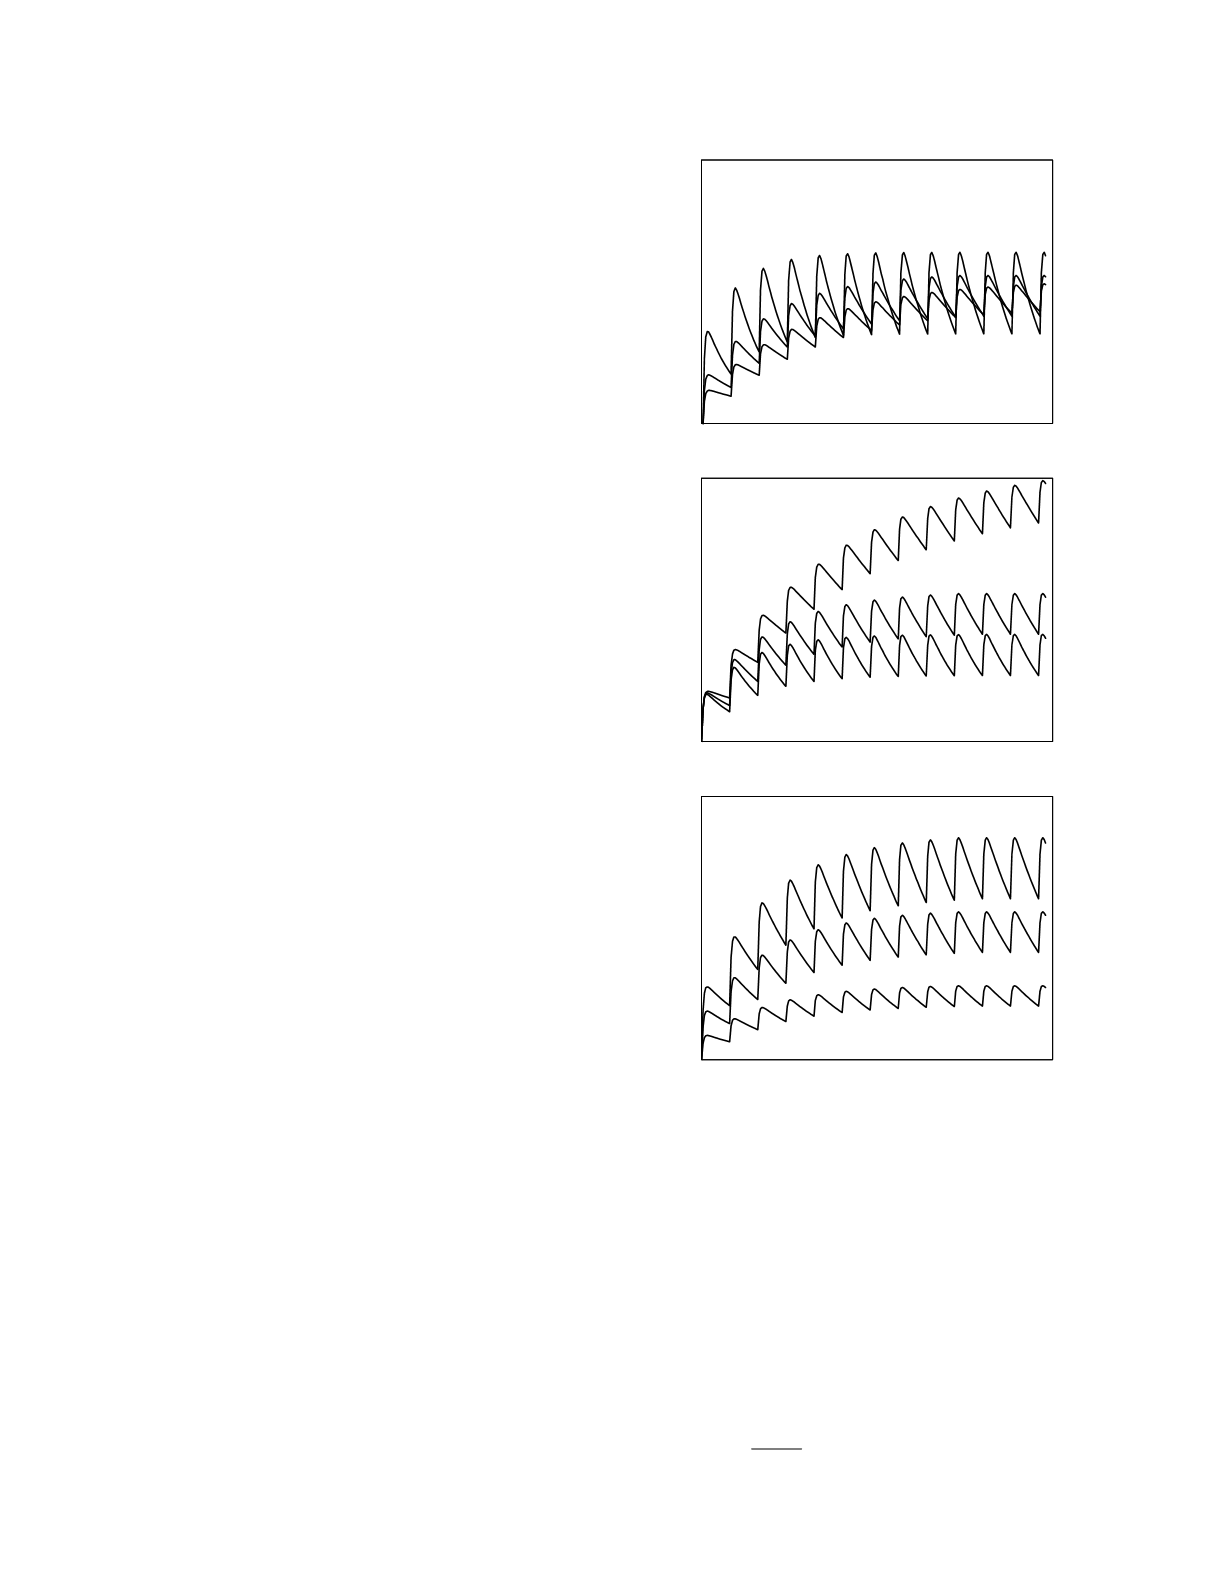
The effects of plasma kinetic variability are
illustrated in Figure 12.7 for multiple dosing of a
drug administered orally. Variability in the initial
volume of distribution (top graph) leads to differ-
ences in the peak and trough drug concentrations
but, in the steady state, the average drug
concentrations are equal. Variability in clearance
rate (middle graph) and variability in bioavailable
fraction (bottom graph) produce drug concentration
differences that increase over time reaching a
maximum in the steady state. As dictated by the
relationship,
C
ss
,
avg
=
F D
m
$
Cl
Drug Therapy
12-6
Figure 12.7
The effects of kinetic variability on the plasma
disposition curve for multiple dosing of an oral drug. In each
graph the kinetic parameter values vary in a 1:2:3 ratio. The
top graph shows the effects of variation in initial volume of
distribution, the middle graph the effects of variation in
clearance rate, and the bottom graph the effects of variation
in bioavailability.
Time
Plasma drug concentration
Time
Plasma drug concentration
Time
Plasma drug concentration
variable V
o
variable Cl
variable F


