plasma concentration. Therapeutic drug monitoring
using the average drug concentration requires
measurement of the area under the plasma drug
disposition curve (AUC) during the dosing interval,
C
ss
,
avg
=
AUC dosing interval
$
This means that obtaining a number of blood speci-
mens during the interval, the optimal number and
timing of which depend upon the plasma disposition
of the drug and the level of reliability desired.
The steady state.
It is generally accepted that
the steady state is achieved 5 half-lives after the start
of drug therapy. For drugs with a single disposition
phase,
t
1/2
=
ln
(1/2)
k
and for drugs with a slow disposition phase,
t
1/2
=
ln
(1/2)
Individualization of the half-life estimate takes into
account the maximum effect that variation in clear-
ance rate has upon half-life,
individualized t
1/2
=
usual t
1/2
Cl
avg
Cl
indiv
Consider the clinical application of this formula in a
patient with a serious Gram-negative infection
receiving gentamicin by short intravenous infusion
on an every 8 h schedule. The patient is a 60 year
old female who weighs 50 kg and has a stable
plasma creatinine concentration of 1.4 mg/dl. The
adequacy of the treatment can be monitored using
the steady-state peak plasma drug concentration
(defined as the concentration 0.5 h after following
the end of drug infusion). The usual half-life of gen-
tamicin is about 2 h. The patient’s creatinine clear-
ance rate is calculated to be 35.8 ml/min using the
formula of Cockcroft and Gault (Table 12.1).
Because gentamicin is eliminated solely by the
kidneys,
Cl
avg
Cl
indiv
=
100
35.8
=
2.8
and
individualized t
1/2
=
2
h
%
2.8
=
5.6
h
Thus, it is necessary to wait 28 h (5 times the half-
life) to obtain a steady-state specimen for therapeutic
drug monitoring.
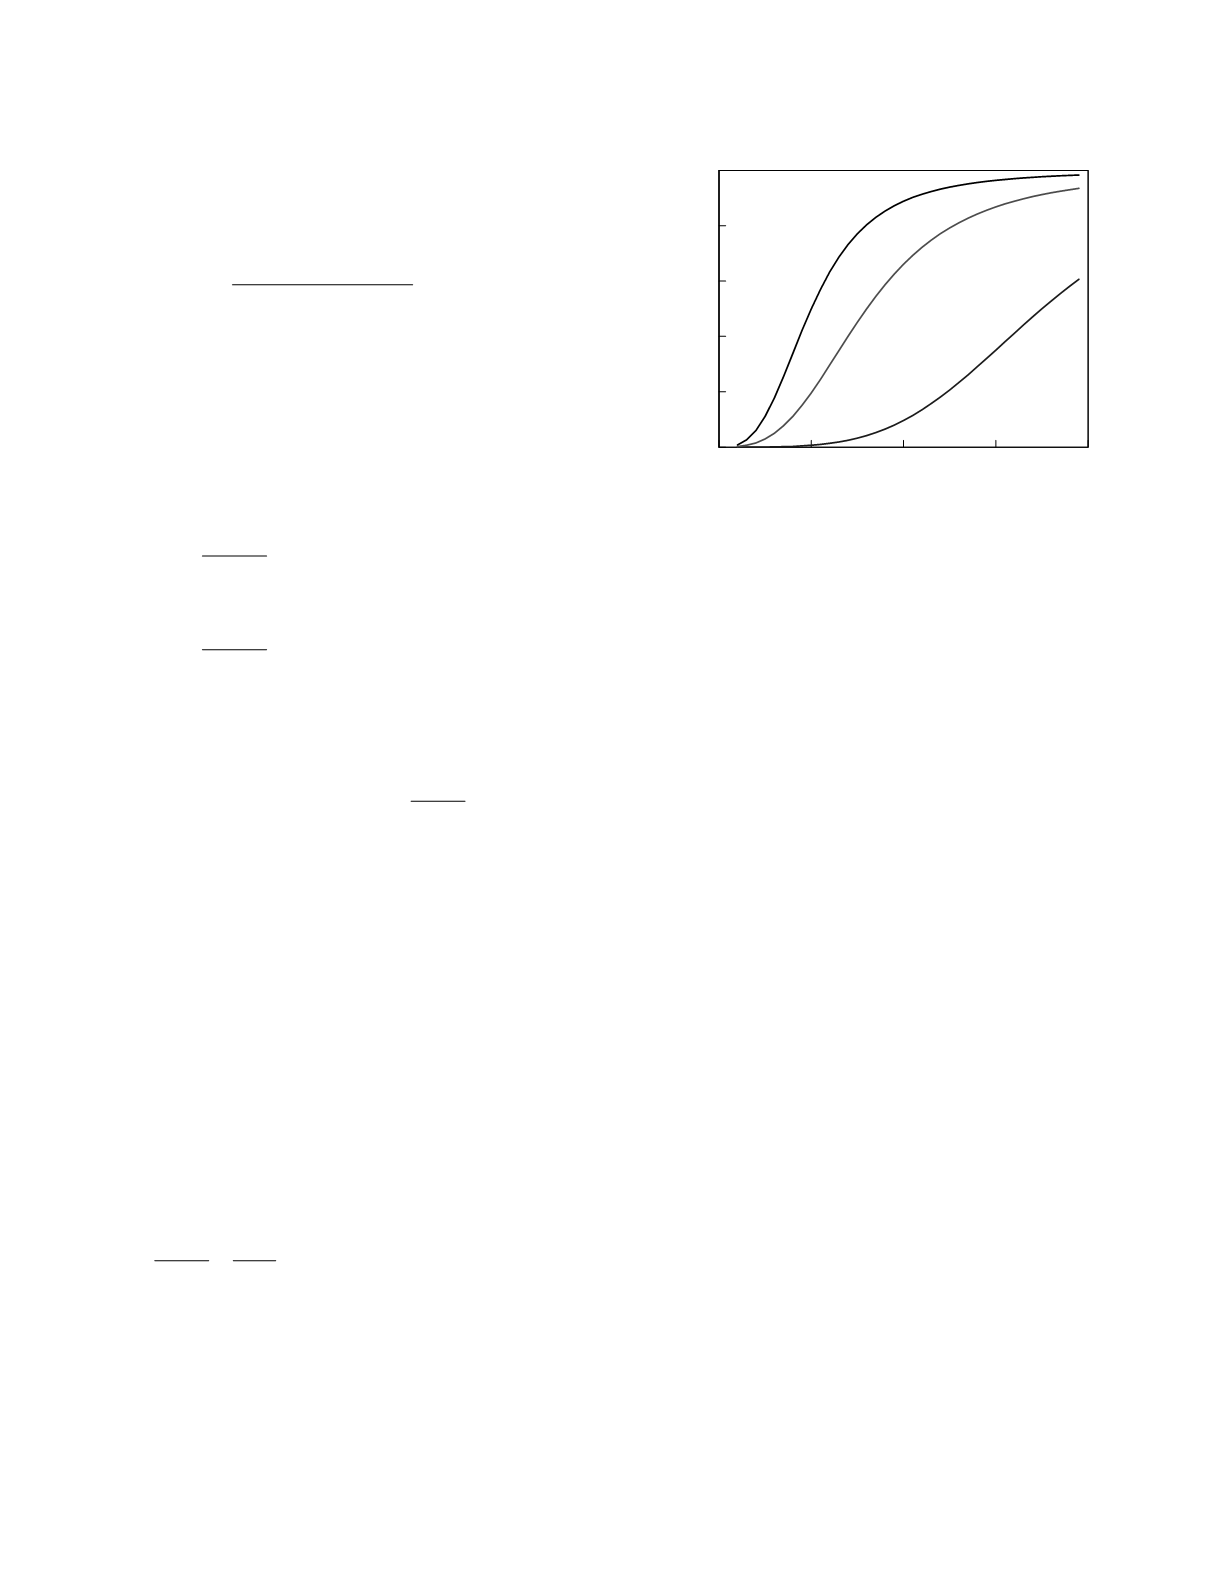
The therapeutic range.
Simply put, the thera-
peutic range is the range of values of the monitoring
marker that have been found to be associated with
generally effective and safe therapy. Figure 12.10
illustrates how a therapeutic range is constructed.
The figure shows plots derived from a hypothetical
study of drug effect for an anti-arrhythmic agent.
The plots show the relationship between the value of
the monitoring marker, here the steady-state trough
plasma drug concentration, and the percentage of
patients who, at that trough concentration value,
experience the stipulated effect. The therapeutic
effect in this example is quantitative, 90 percent
suppression of physiologic arrhythmic activity. The
effect-marker relationships for two toxic effects are
plotted; a nuisance effect, post-dose nausea, is
semiquantitative, and a serious toxic effect, drug-
induced arrhythmic activity, is categorical. The
plots for each of these drug effects are sigmoidal
which is an entirely typical shape. If a threshold of
50 percent is used, efficacious therapy is associated
with trough concentrations greater than 50 µg/ml.
Serious toxicity is seen in less than 5 percent of
patients with trough concentrations less than 85
µg/ml. The therapeutic range, as defined by the
stated thresholds, is, therefore, 50 to 85 µg/ml.
Notice that the measurement of a trough drug
concentration in this range does not assure that
therapy will be effective in the individual patient nor
does it guarantee that the therapy will not have a
serious side effect. In addition, it provides no infor-
mation concerning milder side effects. But it does
provide some assurance that the therapy might be
Drug Therapy
12-13
0
50
100
150
200
Trough drug concentration (µg/ml)
0
0.2
0.4
0.6
0.8
1
Frequency
90% suppression of
arrhythmic activity
mild nausea
drug-induced
arrhythmia
Figure 12.10
Frequency plots of drug effects for a
hypothetical anti-arrhythmic agent.


