of back diffusion depends upon the concentration
gradient established, which is determined by the
extent of water reabsorption, and upon the perme-
ability of the drug, which relates to its lipophilicity.
Drugs are secreted by the renal tubular organic anion
or cation transport systems. Some drugs are actively
reabsorbed from tubular urine, and others, such as
aminoglycosides, are taken up from the tubular urine
by tubular cell pinocytosis. Although tubular secre-
tion and reabsorption usually display first-order
kinetic behavior, they are saturable processes.
Multiple dosing
In drug therapy the usual practice is to produce
drug effects beyond the length of time that can be
achieved by the administration of a single dose of the
drug. Multiple dosing is then necessary. The
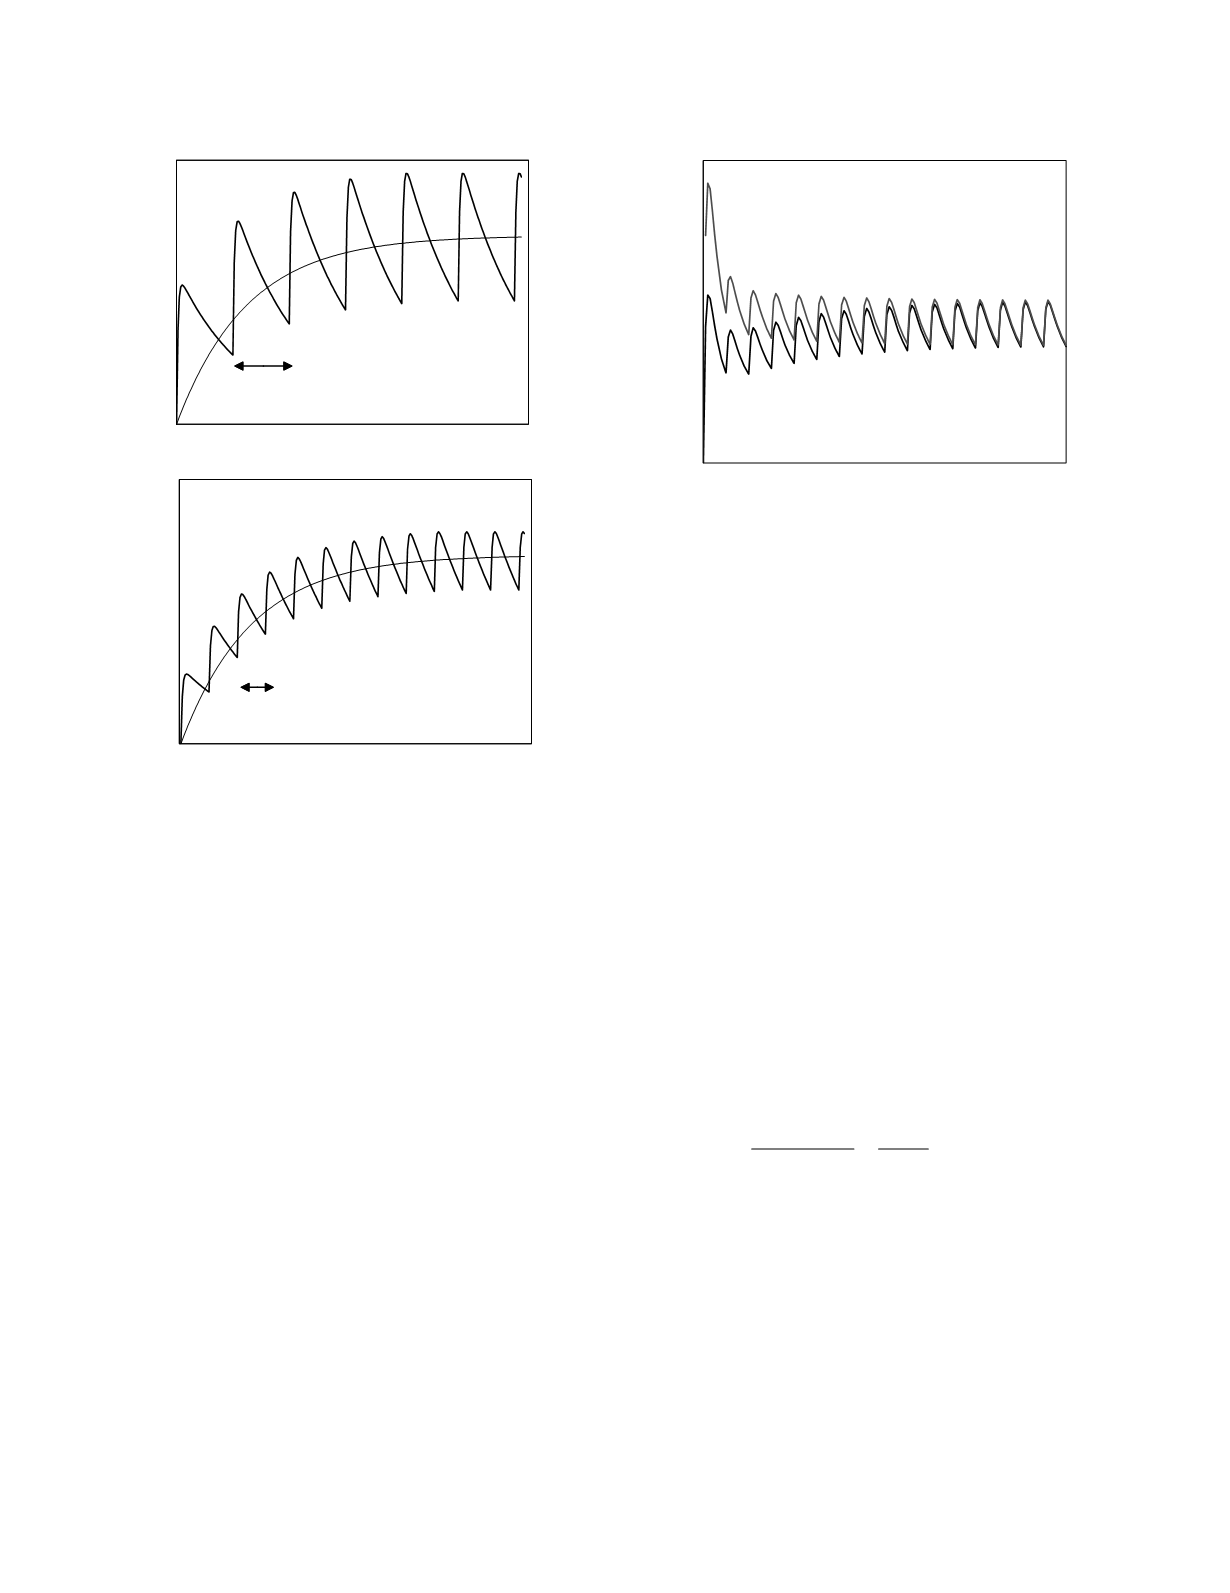
characteristic plasma kinetics of a drug given on a
regular schedule is shown for a hypothetical drug in
Figure 12.4. For simplicity, the absorption kinetics
of the drug are modeled as being very fast; conse-
quently, the plasma drug concentration rapidly
reaches its maximum value. The bottom graph
shows the plasma kinetics that result if the dosing
regimen shown in the top graph is changed by
halving the dosing interval,
τ
, and halving the main-
tenance dose, D
m
, so that the dosing rate remains the
same. The features to notice in the figure are: 1)
within each dosing interval the plasma drug concen-
trations have a maximum (peak) value, a minimum
(trough) value, and an average value; 2) the magni-
tude of the fluctuations in plasma drug concentration
is directly related to the length of the dosing
interval; 3) early on, the average concentration
increases in magnitude with each dose (although, if
the dosing interval is prolonged, the plasma concen-
trations at the end of the interval are negligible and
the average concentration remains the same from
dose to dose); 4) later on, the average concentration
is the same for each dose, indicating that a steady
state develops, wherein
C
ss
,
avg
=
dosing rate
Cl
=
F D
m
$
Cl
where
C
ss,avg
is the average plasma drug concentra-
tion in the steady state; 5) the average plasma drug
concentration in the steady state is the same regard-
less of the dosing interval, given constancy of the
dosing rate; and 6) the time required to reach the
steady state is the same regardless of the dosing
interval.
Loading dose.
It is frequently desirable to
achieve plasma drug concentrations in the vicinity of
the steady-state concentration early in drug therapy,
sooner than would happen in the normal course of
Drug Therapy
12-4
Time
Plasma drug concentration
Time
Plasma drug concentration
C
avg
C
avg
dosing
interval
dosing
interval
Figure 12.4
Plasma disposition curves resulting from multi-
ple dosing of an oral drug. The dosing interval and mainte-
nance dose in the lower graph are half those in the upper
graph.
Time
Plasma drug concentration
D
l
= C
ss,avg
V
o
/ F
D
l
= C
ss,avg
V
β
/ F
Figure 12.5
Plasma disposition curves resulting from multi-
ple dosing of an oral drug following a loading dose. The
loading doses that apply to the curves are indicated. The
maintenance doses are the same for both curves.


