significantly larger than that under the transferrin
saturation curve, so, overall, ferritin is a
better—indeed, much better—study for the diagnosis
of iron deficiency. Nonparametric statistical
methods (i.e., methods that do not employ paramet-
ric data modeling) are also available for analyzing
ROC curves (McNeil and Hanley 1984, DeLong
et
al.
1988).
Not infrequently, the comparison of the
performance of different laboratory studies is
relevant only within a certain range of performance
criteria, such as when a study is sought to confirm
the presence of disorder in an individual for whom
the diagnosis is likely, or to exclude an important
but unlikely alternative diagnosis, or to screen for a
disorder among asymptomatic individuals. Which
studies perform these specific clinical tasks best is
revealed by a consideration of the performance
characteristics necessitated by each.
In the case of a study to be used to confirm a
diagnosis, it was shown that study results associated
with likelihood ratios larger than the threshold ratio
for acceptance of the diagnosis are considered
confirmatory. Many studies may have results that
satisfy this performance criterion. Which is the
preferred study? It seems reasonable to propose that
the study with the greatest sensitivity should be
preferred. This assures that the maximum number of
patients afflicted by the disorder will have the
diagnosis confirmed when the study is performed.
When selecting among excluding studies, the study
with the largest specificity at the study result giving
the threshold likelihood ratio for rejection should be
preferred. Then the greatest number of patients free
of the condition will have the diagnosis excluded.
Because the object of screening studies is to detect a
disorder, they must be sensitive. So, the preferred
screening study should be the one with the highest
sensitivity at the study value yielding the threshold
likelihood ratio for followup.
The application of these selection rules for
confirming and excluding studies are illustrated by
considering the choice between plasma ferritin
concentration and transferrin saturation in the
diagnostic evaluation of an adult patient who is
anemic. If the clinician's mindset is to prove that
iron deficiency is not the cause of the anemia, he or
she will want to order the study that is the preferred
excluding study. If a diagnosis of iron deficiency is
sought, so that iron therapy can be initiated
promptly, the study that better serves as a
confirming study should be ordered. If the prior
probability of iron deficiency is assumed to be 0.35
and the threshold probability for accepting a diagno-
sis of iron deficiency is 0.7, the threshold likelihood
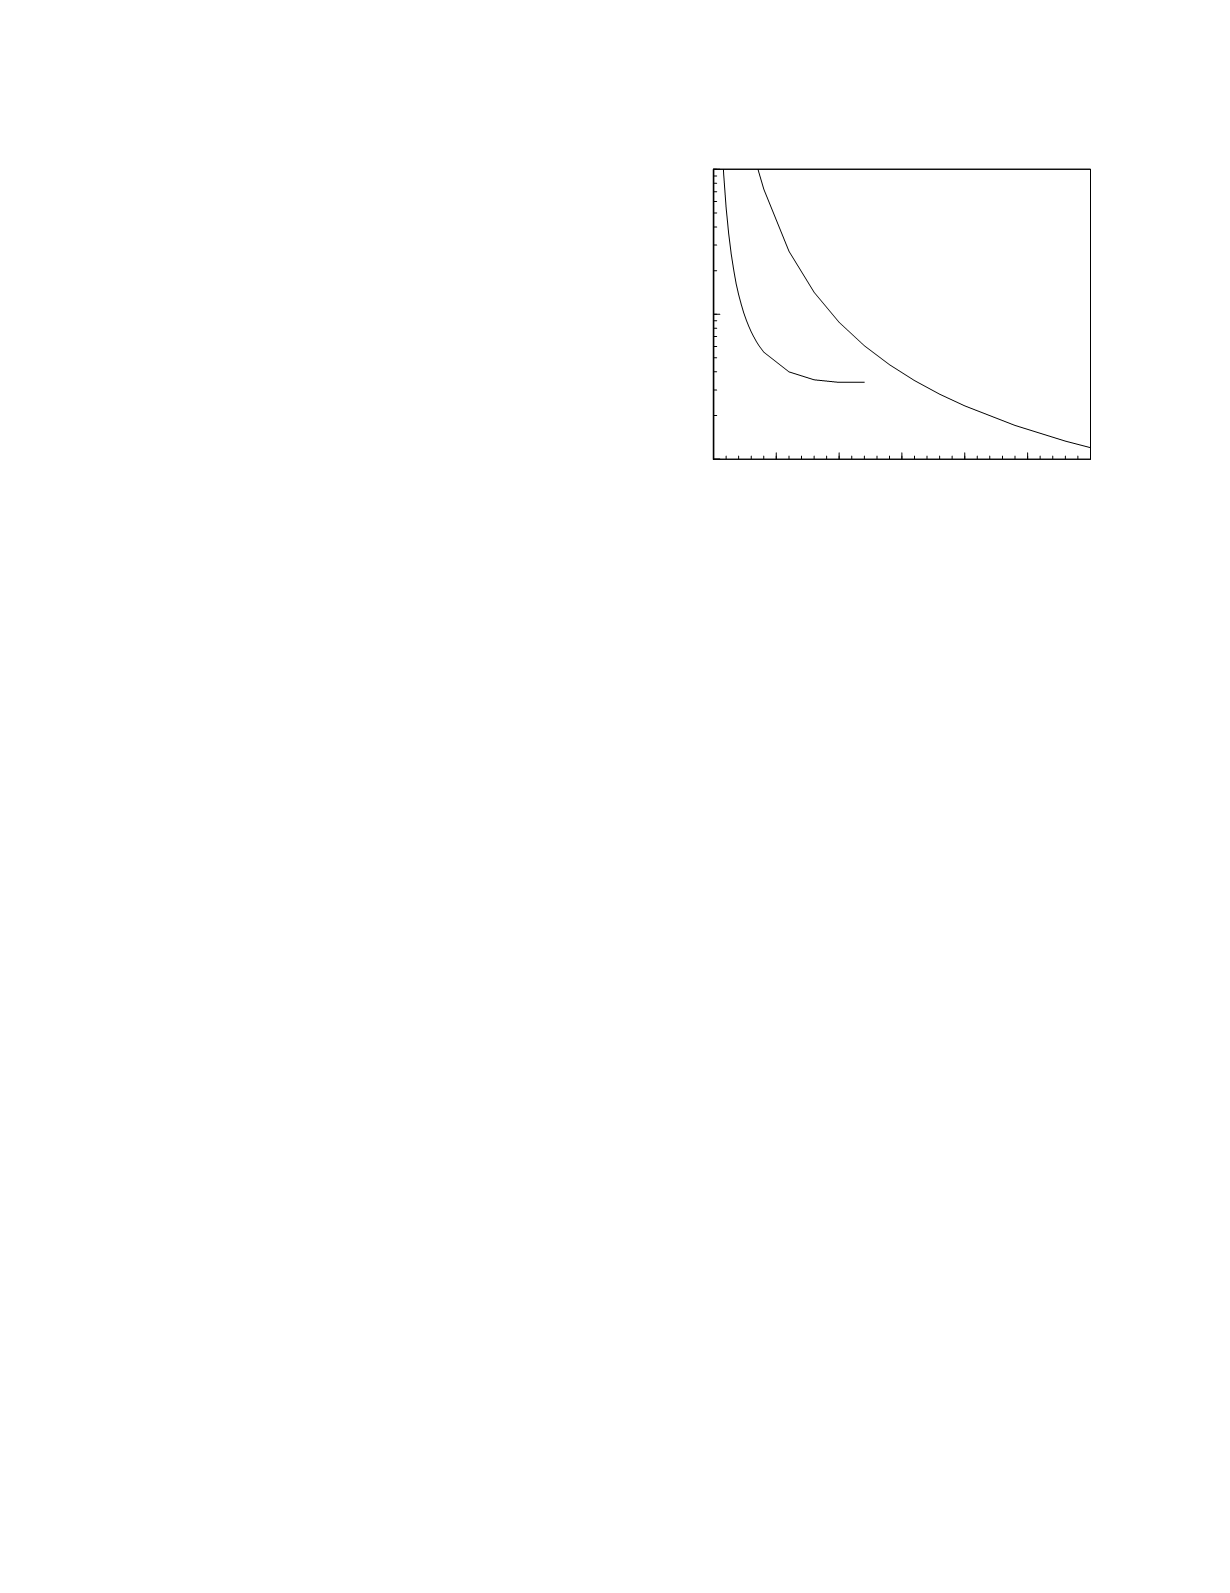
ratio for acceptance is 4.33. Figure 3.13 shows the
likelihood ratio of iron deficiency as a function of
the study value for ferritin concentration and trans-
ferrin saturation based on the lognormal modeling of
the data reported by Guyatt
et al.
(1992). Both
studies have results that yield a likelihood ratio of
4.33, for ferritin it is a concentration of 25 µg/L and
for transferrin saturation it is a value of 5.6%. At
these values, transferrin saturation has a sensitivity
of 0.26 and ferritin has a sensitivity of 0.75 so
ferritin is by far the superior test for confirming the
diagnosis. Using 0.1 as the threshold probability for
rejecting a diagnosis of iron deficiency, the threshold
likelihood ratio for rejection is 0.21. There is no
value at which transferrin saturation has a likelihood
ratio this low, so it cannot be used to exclude the
diagnosis. Ferritin has the requisite likelihood ratio
at a concentration of 107 µg/L. At that concentra-
tion, the specificity of the study is 0.70 making
ferritin a very good study for excluding the
diagnosis.
PROGNOSTIC STUDY PERFORMANCE
Prognostic laboratory studies are used in two
ways: to aid in predicting the outcome of an illness
and to help predict if an individual will develop or
relapse from a disorder at some specific time in the
Diagnostic and Prognostic Classification
3-15
0
25
50
75
100 125 150
Ferritin (µg/L)
Transferrin saturation (%)
0.1
1
10
Likelihood ratio of iron deficiency
transferrin
saturation
ferritin
Figure 3.13
The likelihood ratio of iron deficiency as a
function of ferritin and transferrin saturation based on
lognormal frequency distribution models of the data.


