Imprecision.
Variability in the quality of epide-
miologic investigations of disease prevalence and in
the performance and interpretation of clinical studies
produces estimates of prior probability that are
imprecise. Imprecision in estimates of the likelihood
ratio arise from limitations in the quality of perform-
ance evaluations of laboratory studies and from the
presence of inter-laboratory variability in the techni-
cal performance of the studies. Consequently,
posterior probabilities arrived at using Bayes'
formula are also imprecise (Diamond and Forrester
1983, Machin
et al.
1983).
As a simple example, consider a case in which
the estimate for the prior probability is 0.5 and that
for the likelihood ratio of 3. Application of Bayes'
formula using these estimates yields a posterior
probability estimate of 0.75. Now suppose that the
estimate of prior probability is not exact but instead
consists of a 25 percent chance of a probability of
0.4, a 50 percent chance of a probability of 0.5, and
a 25 percent chance of a probability of 0.6. Further
suppose that the likelihood ratio estimate actually
consists of a 25 percent chance of a ratio of 2, a 50
percent chance of a ratio of 3, and a 25 percent
chance of a ratio of 4. If the true prior probability is
0.4 and the true likelihood ratio is 3, then the poste-
rior probability is 0.67. Since the chances of the
true prior probability being 4 and the true likelihood
ratio being 2 are 0.25 and 0.5, respectively, the
chance that both are the true values is 0.125 (the
product of the separate chances). The complete
distribution of values for the posterior probability
(shown in Table 3.4) is obtained by repeating the
foregoing calculations for all of the possible combi-
nations of prior probability and likelihood ratio and
aggregating the chances that correspond to identical
values of the posterior probability (Iversen 1984).
The range of values for the posterior probability is
0.57 to 0.86 with a central 87.5 percent confidence
interval of 0.67 to 0.82. Notice that there is only a
0.3125 chance that the posterior probability is 0.75,
the value calculated using the mean values for the
estimates of the prior probability and likelihood
ratio; the chances are 0.375 that the actual posterior
probability is lower than 0.75 and 0.3125 that it is
higher.
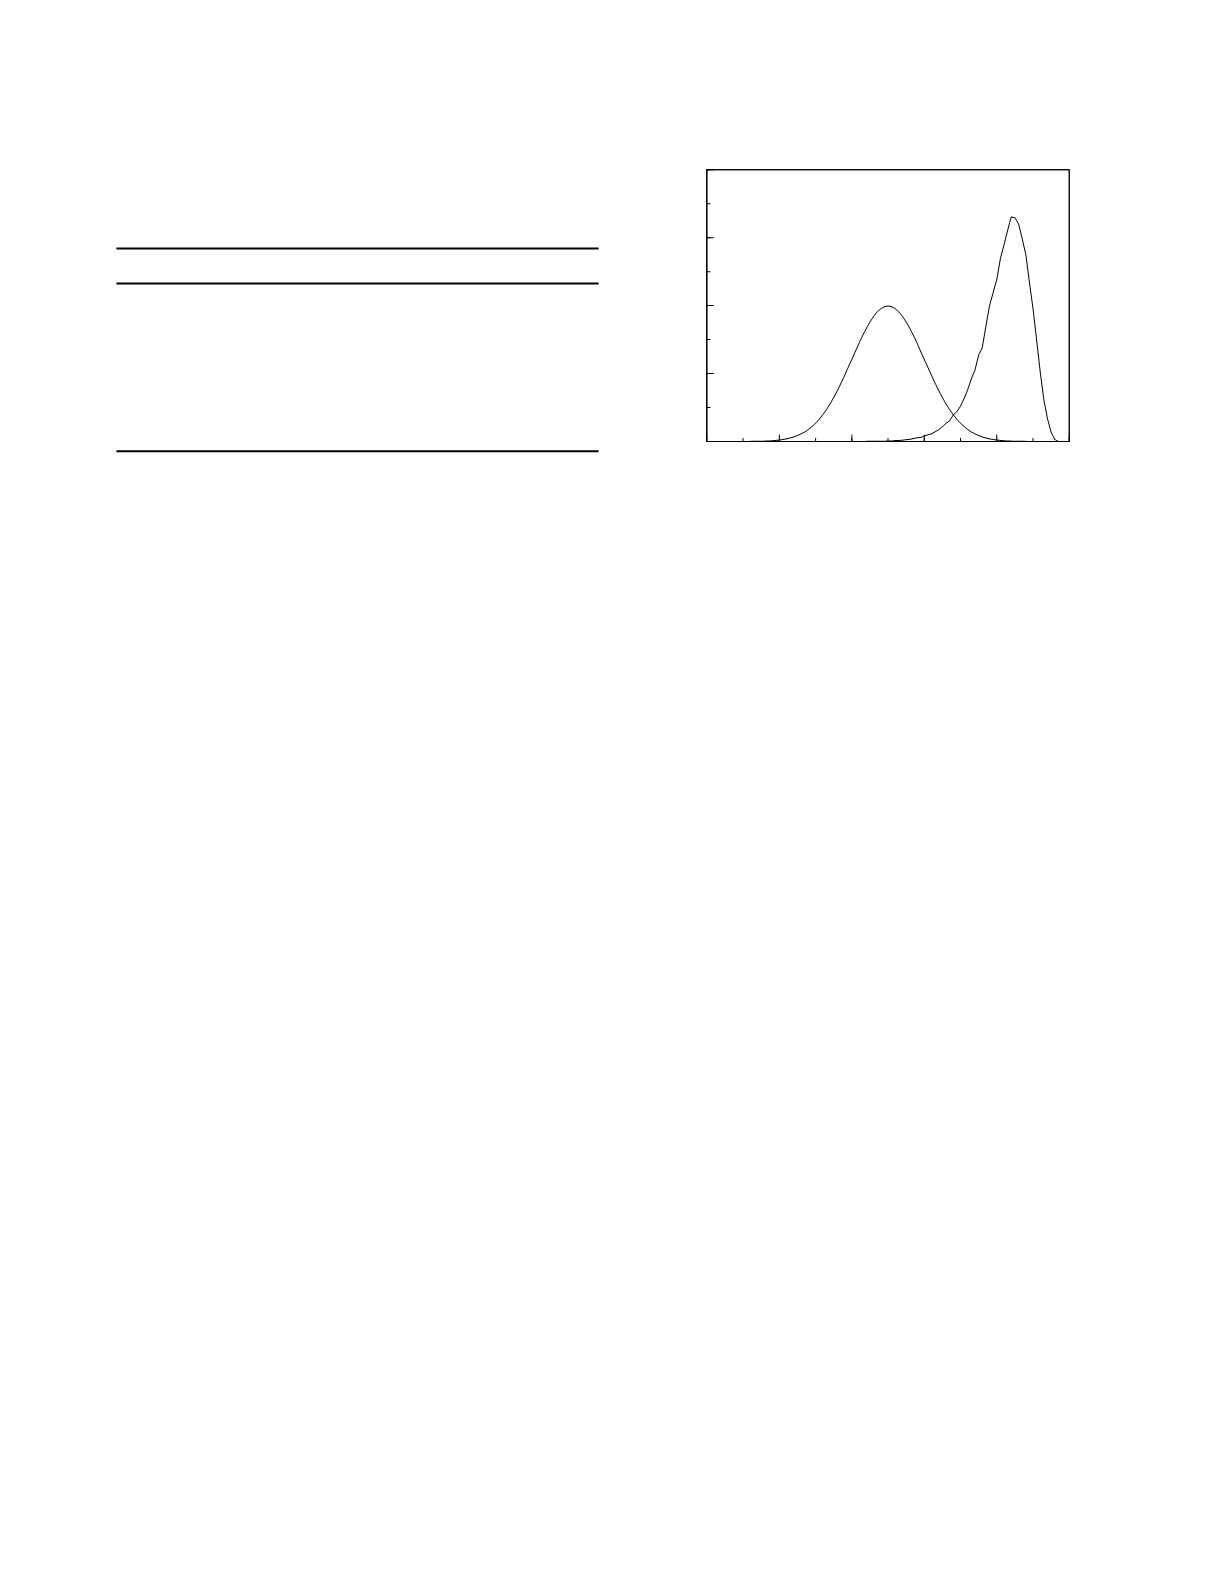
A somewhat more realistic example of the
use of Bayes' formula when there is imprecision in
the estimates of the prior probability and the likeli-
hood ratio is illustrated in Figure 3.11. In this
example the estimates of the prior probability and
the likelihood ratio vary in a continuous fashion
according to normal distributions. The mean value
and standard deviation are set at 0.5 and 0.1, respec-
tively, for the prior probability and at 5 and 1,
respectively, for the likelihood ratio. The distribu-
tion of posterior probabilities that results from these
inputs is left-skewed with a mode of 0.84. The
central 90% confidence interval for the distribution
is 0.69 to 0.91.
In practice, the imprecision inherent in the
estimation of disease probabilities is rarely explicitly
calculated in the foregoing quantitative fashion.
Nevertheless, the clinician must always be mindful
of such uncertainty, especially when prior probabili-
ties and study performance measures are derived
from research investigations with relatively small
numbers of patients.
Study results that confirm or exclude a diagnosis
A confirming study result is one that raises the
probability of a suspected diagnosis past the
Diagnostic and Prognostic Classification
3-12
Table 3.4
Distribution of posterior probabilities for an example
with imprecise prior probability and likelihood ratio
estimates
P[post]
Distribution
0.57
0.0625
0.67
0.2500
0.73
0.0625
0.75
0.3125
0.80
0.1250
0.82
0.1250
0.86
0.0625
0
0.2
0.4
0.6
0.8
1
Probability estimate
0
2
4
6
8
Density
prior
posterior
Figure 3.11
Distributions of prior and posterior probability
for an example with normal distributions of the estimates of
the prior probability and the likelihood ratio.


