ROC curves.
The diagnostic performance of a
study depends upon the choice of the critical value.
This is the study result used to separate the diagnos-
tic classes. In the example from Dallman
et al.
(1981), the critical value of transferrin saturation
that was used was 10%. Selection of a different
critical value would have resulted in different values
for sensitivity and specificity. The set of sensitivity
and specificity pairs that are generated by consider-
ing every possible critical value for a laboratory
study constitute the performance characteristic
function. This function completely defines the
performance of the study when applied to a given
pair of reference frequency distributions. Conse-
quently, it is the most informative way to record the
findings from an investigation of the study's
performance (Henderson 1993, Zweig and Campbell
1993, Beck and Shultz 1986). Using it, one can
identify the critical value that generates a desired
pairing of sensitivity and specificity.
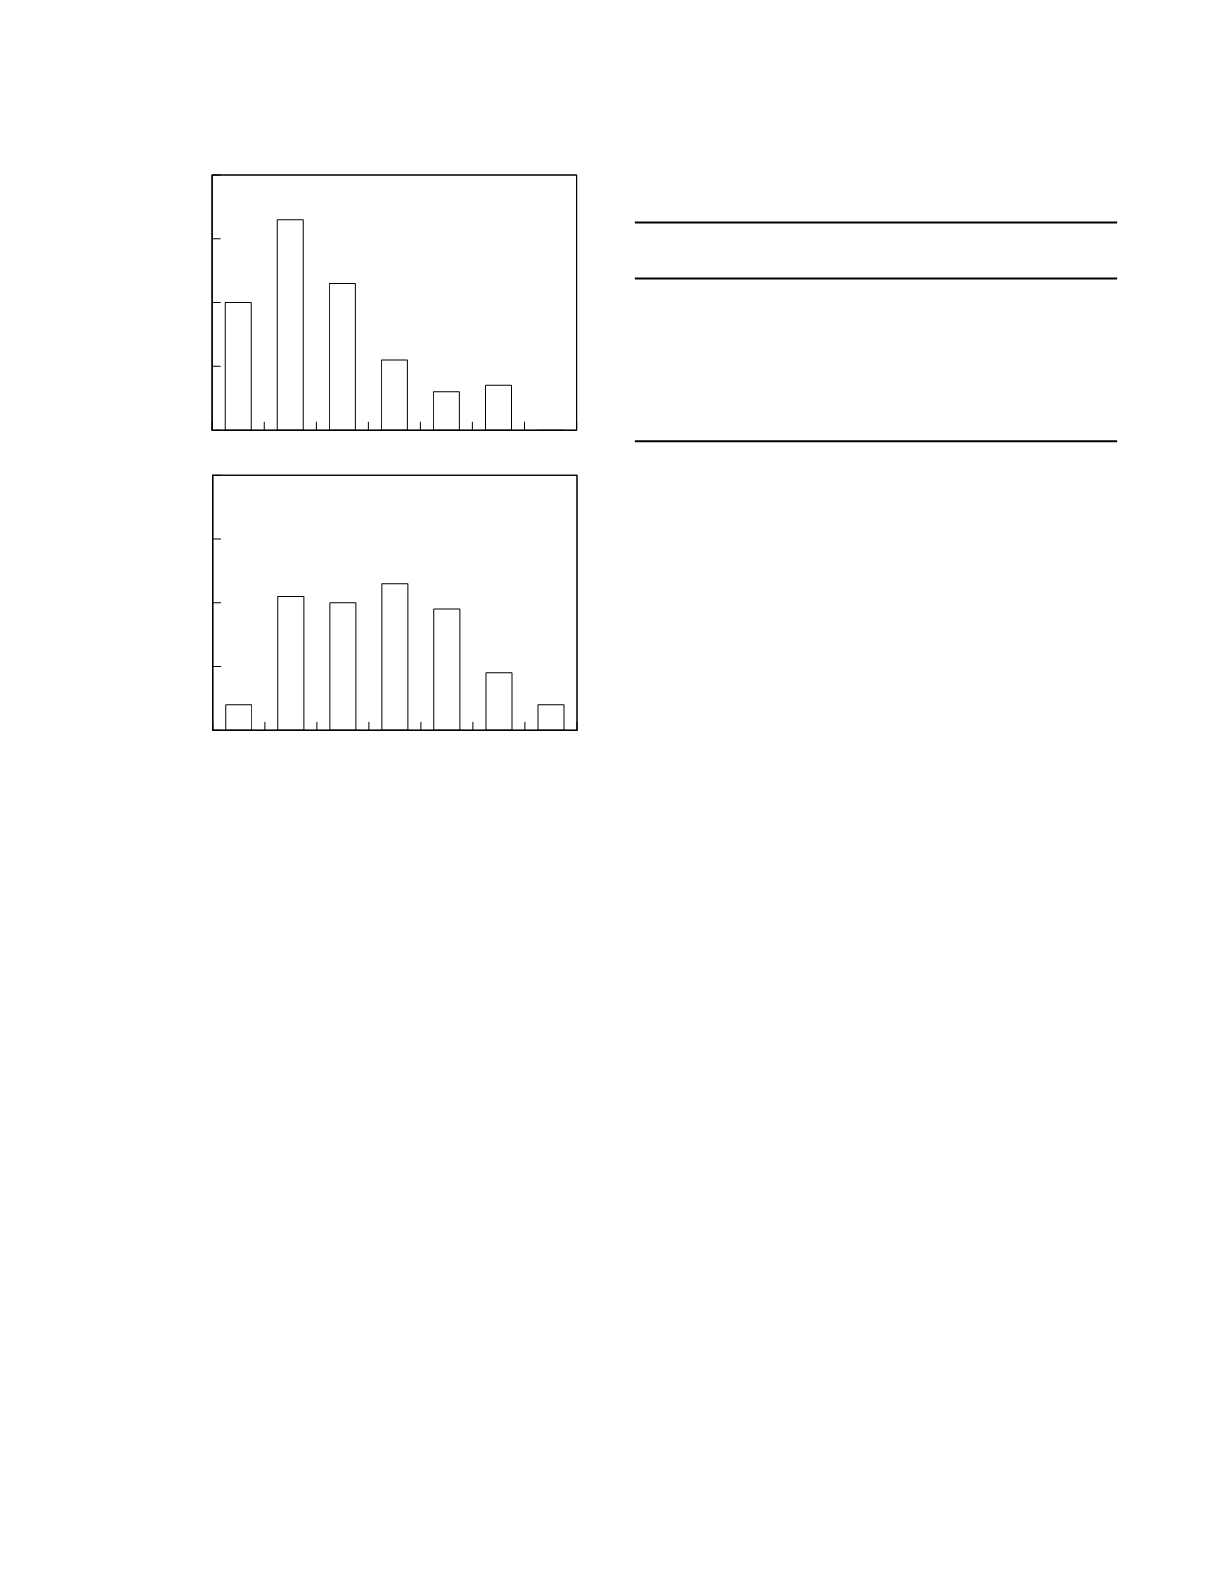
A performance characteristic function for trans-
ferrin saturation can be obtained by again referring
to the data reported by Dallman
et al.
(1981). The
authors include in their article histograms indicating
the distribution of study values in the two reference
populations. Their histograms are recast as
frequency distributions in Figure 3.1. To construct
the performance characteristic function, first select
an extreme study value (here 0% is a likely choice)
and calculate the sensitivity and specificity that
would result were this the critical value. No iron-
deficient subject has a transferrin saturation less than
0% so the sensitivity is 0. All the iron-replete
subjects have saturations greater than 0% so the
specificity is 1.0. Then, repeat the calculations
using the next permissible value of the study, 5%, as
the critical value. Since 20 percent of the iron-
deficient infants have transferrin saturations below
5%, the sensitivity is 0.2. Of the iron-replete
subjects, 4 percent have saturations less than 5% so
only 96 percent of these subjects are correctly identi-
fied. Thus, the specificity is 0.96. This procedure
is repeated until all the possible critical values have
been considered. The results for these data are
shown in Table 3.3. Performance characteristic
functions are often presented in their graphic form
which, for historical reasons, are called receiver
operating characteristic or ROC curves. Figure 3.2
(squares) shows the ROC curve for transferrin
saturation.
As discussed in Chapter 1, the distribution of
study results in reference populations can be repre-
sented by frequency distribution models. Such
modeling yields two significant benefits in the
construction of ROC curves. First, irregularities in
the empirical data attributable to measurement
variability are smoothed out and, in turn, so are the
derived values of sensitivity and specificity.
Second, gaps in the data corresponding to study
values that were not recorded among the reference
subjects can be filled in. Indeed, the use of continu-
ous distribution models allows for the construction
Diagnostic and Prognostic Classification
3-2
Table 3.3
Performance Characteristic Function for Transferrin
Saturation
Critical Value Performance Characteristic
Sensitivity
Specificity
0%
0.00
1.00
5%
0.20
0.96
10%
0.53
0.75
15%
0.76
0.55
20%
0.87
0.32
25%
0.93
0.13
30%
1.00
0.04
Figure 3.1
Reference frequency histograms for transferrin
saturation.
0-5 6-10 11-15 16-20 21-25 26-30 > 30
0
0.1
0.2
0.3
0.4
Frequency
0-5 6-10 11-15 16-20 21-25 26-30 > 30
Transferrin saturation (%)
0
0.1
0.2
0.3
0.4
Frequency
iron-deficient
patients
iron-replete
patients


