where, for the 95% range,
z
c
equals 1.96, and
SD
result pairs
=
var
method
1
+
var
method
2
The width of the range will vary with analyte
concentration if the variance of either method
depends upon the concentration. In the figure, the
variance was treated as being proportional to analyte
concentration. The darker, outer lines delimit the
region in which 95% of the data pairs will be if the
methods are concordant to within a clinically accept-
able amount of bias. These are the clinical equiva-
lence boundary lines. These boundary lines are
constructed using the formula,
range = analyte concentration
±
( z
c
SD
result pairs
+ acceptable bias)
The upper graph in Figure 2.9 shows the
hypothetical results of a comparison of two highly
concordant methods. All of the data points are
inside of the clinical equivalence boundary lines
(here the bias criterion is a relative bias of less than
7.5%). Using the approximate formula (Newcombe
1998),
confidence interval =
estimate
+
z
c
2
2
N
!
z
c
estimate
(
1
−
estimate
)
N
+
z
c
2
4
N
1
+
z
c
2
N
where
N
is the number of data pairs, the approxi-
mate 95% confidence interval on the proportion is
95.4 to 100%. Because it is statistically certain that
at least 95% of the data pairs are contained within
the boundary lines, the concordance of the methods
satisfies the criterion for clinical equivalence. The
lower graph shows hypothetical results from two
methods which are discordant. Seventy percent of
the data points are inside of the clinical equivalence
boundary lines with a 95% confidence interval of
51.5 to 72.3%. It is, therefore, statistically certain
that fewer than 95% of the data pairs are contained
within the boundary lines. Hence, the methods are
not clinically equivalent due, in this case, to the
presence of an unacceptably large inter-method bias.
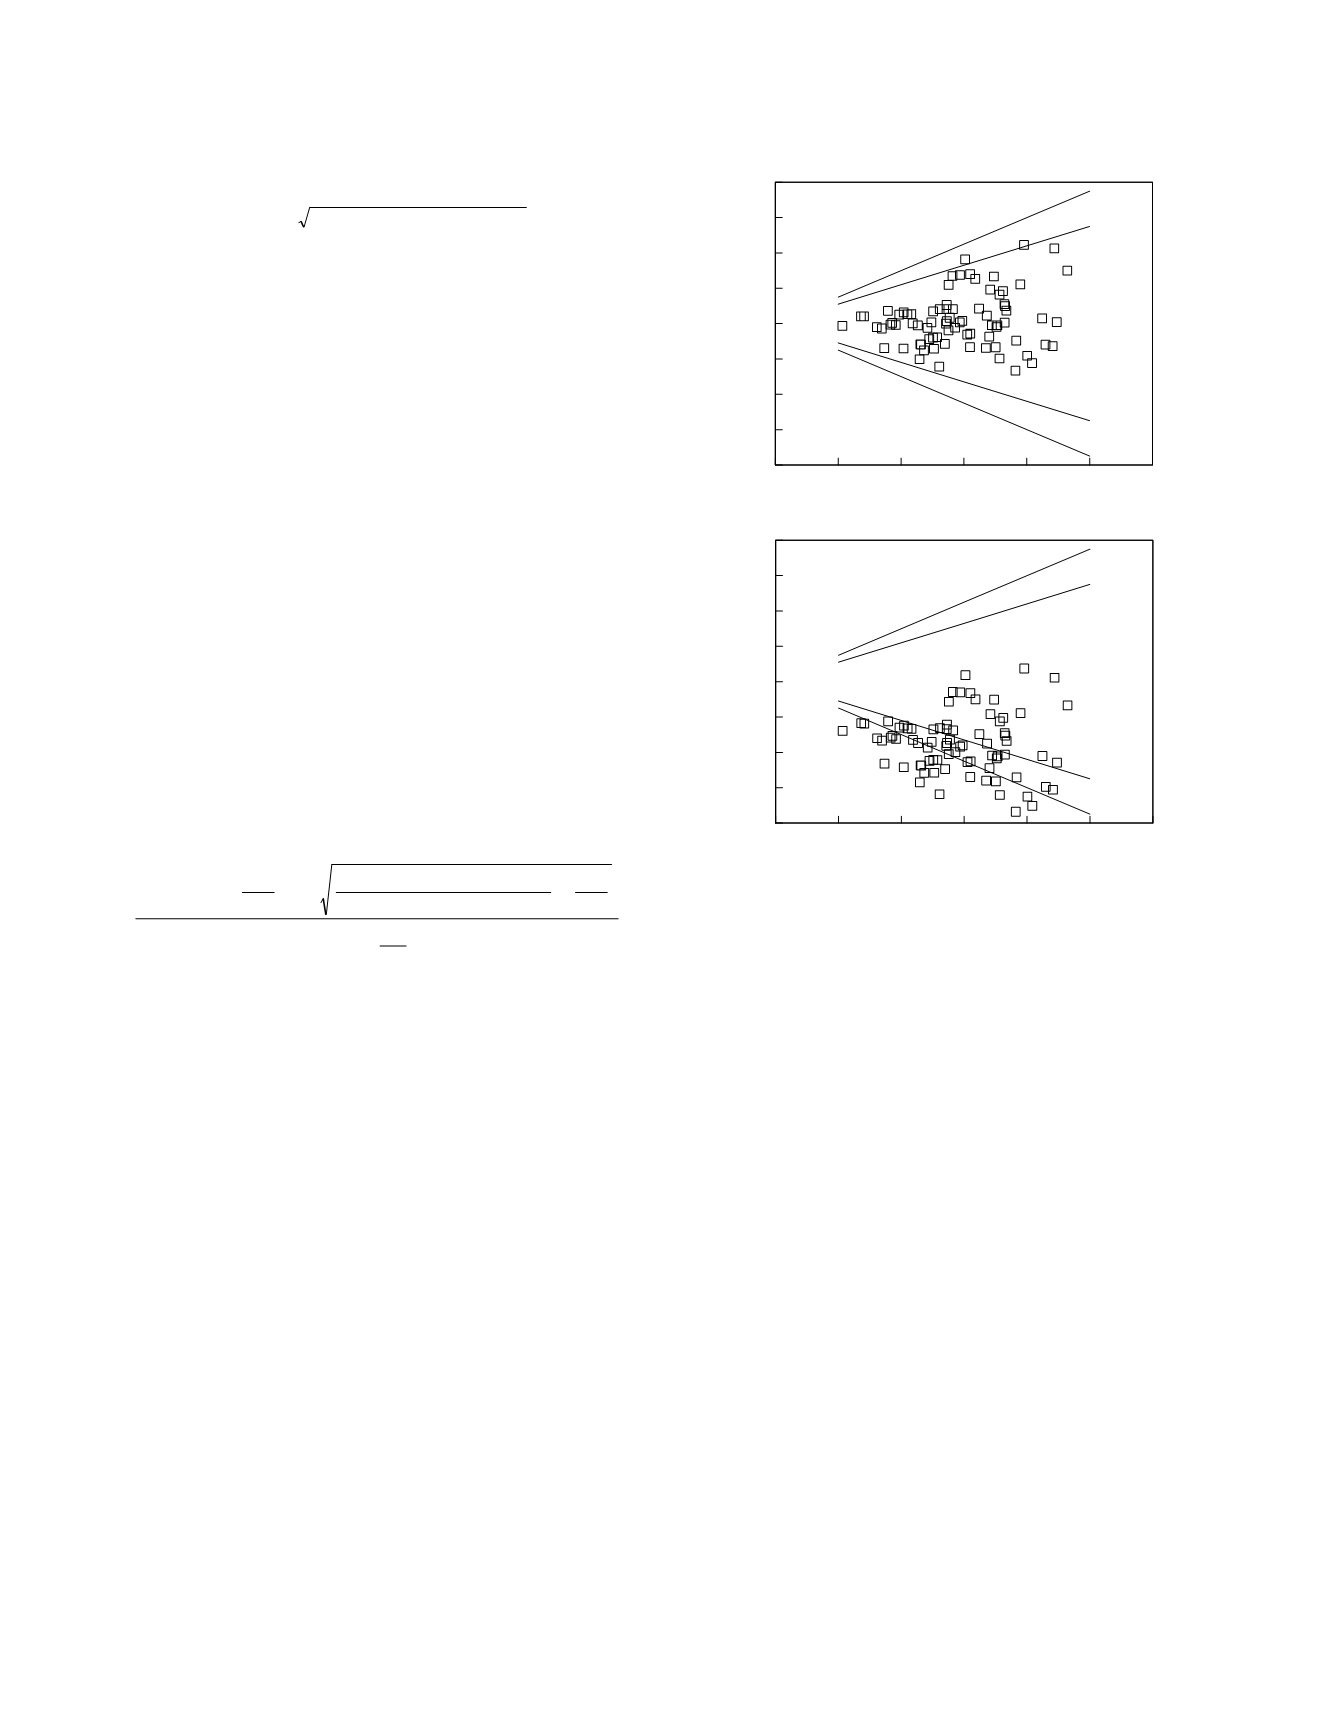
A similar graphical approach can be taken when
the result data are plotted as differences (Petersen
et
al.
1997). This is shown in Figure 2.10 for the
same hypothetical data that were used to make
Figure 2.9. Notice that in this figure, the x-axis is
the result as measured by the field method already in
place (method 1). When plotted in this fashion, the
graphs of the two data sets reveal exactly the same
percentage of data points inside of the clinical
equivalence boundary lines.
Based upon the difference analysis findings,
Turpeinen
et al.
conclude that the methods they
studied do not demonstrate a clinically acceptable
degree of concordance. The authors also
constructed reference ranges for HbA
1c
using two of
the methods under study:
Reference values for the Diamat and PolyCAT
A methods were determined by using 60
freshly drawn blood samples from healthy
controls
They found that the ranges are not similar:
For IMx a reference range of 4.5–5.5% has
been reported (7). Our estimates [of] the
reference values for HbA
1c
with the PolyCAT
A and Diamat methods with samples from 60
Laboratory Methods
2-28
0
20
40
60
80 100 120
Method 1 result
-40
-30
-20
-10
0
10
20
30
40
Result difference
0
20
40
60
80 100 120
Method 1 result
-40
-30
-20
-10
0
10
20
30
40
Result difference
Figure 2.10
The same hypothetical method comparison
data as in Figure 2.9 but here presented as difference plots.
The data are shown as symbols. Clinical equivalence
boundary lines are indicated.


