where
r
2
is the square of the correlation coefficient
and
n
is the number of data pairs. The approximate
confidence interval for the intercept is
,
b0 ± t
c
standard error of b1
x
2
n
where
Σ
x
2
is the sum of the squared x values.
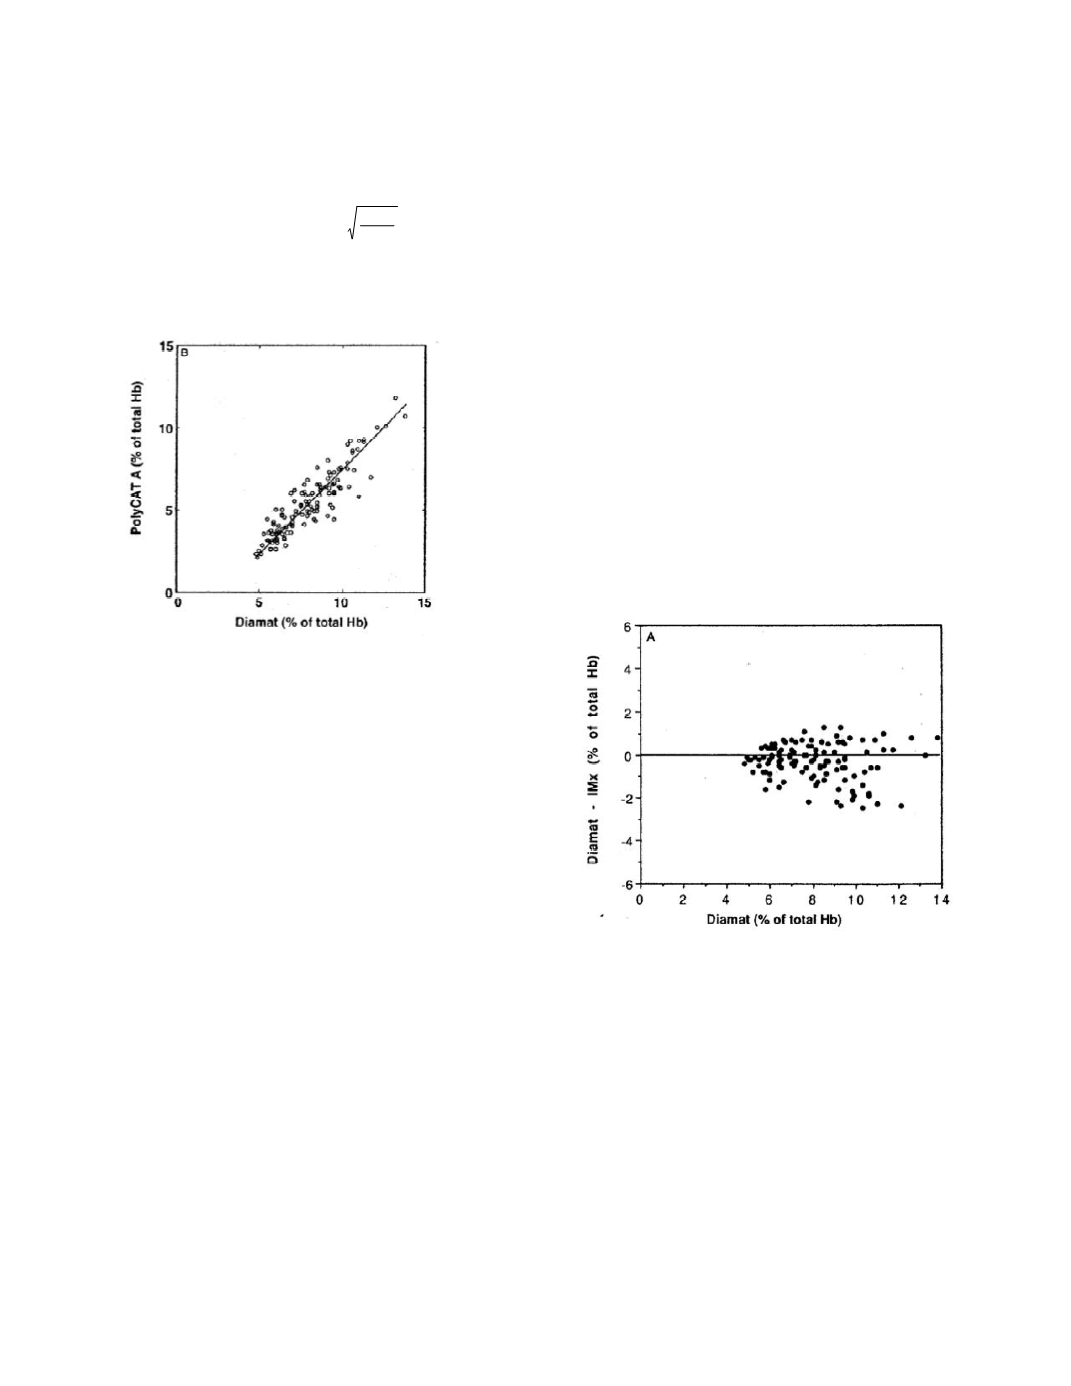
The graph of the data and Deming regression
line for the Diamat and PolyCAT A pairing is:
The result concordance of these methods is much
less good that that between the Diamat and IMX
methods:
When the two ion-exchange chromatographic
methods, PolyCAT A and Diamat, were
compared (Fig 2B) . . . the regression
equation (PolyCAT A = 1.03 Diamat - 2.84)
shows that much lower results were obtained
by ion-exchange chromatography with high
resolution.
The 95% confidence intervals on the estimates of the
slope and intercept are 1.026 to 1.038 and -2.842 to
-2.834, respectively. Although the slope is statisti-
cally different from 1, the difference is small, so the
authors conclude that the lack of concordance
appears to be due largely to constant bias. The
authors offer the following explanation for the bias:
This might be due to the fact that the Diamat
method also measures carbamylated and acety-
lated forms of Hb
…
and possibly some other
derivatives formed in blood during storage,
which can be separated from the HbA
1c
peak
by using methods with higher resolution. Our
PolyCAT A assay has been optimized to
separate different Hb variants from HbA
1c
.
This apparently partly explains the lower
results obtained by this method. However,
the difference between Diamat method and
PolyCAT A assay cannot be explained only by
carbamylated and acetylated Hbs, for which
concentrations <0.4% have been reported
…
Difference analysis.
Difference analysis was
introduced as an approach for evaluating method
comparisons by Altman and Bland (1983). This
approach strives to avoid the shortcomings of
ordinary regression analysis for method comparison
by directly measuring how well each result pair
agrees in terms of the difference in the values of the
results. The differences are plotted against the
average values of the result pairs (Bland and Altman
1986, Hollis 1996) or, as in the article by Turpei-
nen
et al.,
the differences are plotted against the
results of one of the methods. In the comparison of
the IMx and Diamat methods, the plot, called a
difference plot, is:
Examination of the difference plot suggests that
there is a small inter-method bias present because
there are more negative differences than positive
differences. If there were no bias present, the
differences would be evenly distributed about the
line of zero difference. The authors describe the
pattern as follows:
The bias observed (Fig 3A) suggests that the
IMx method gives slightly higher results than
the Diamat method at high amounts but
similar results at normal amounts of HbA
1c
.
The difference plot for the Diamat and PolyCAT A
method pairing is:
Laboratory Methods
2-26


