more familiar technique of ordinary linear regression
analysis has as one of its underlying assumptions that
the x variable has no appreciable measurement
variability (Berry 1993). In order for this assump-
tion to be satisfied, the variability in the x variable
must be small compared to the variability in the y
variable. In method comparison studies, however, it
is typical for the x variable, i.e. the test results
obtained using one method, to have a variability
comparable to that of the y variable, the test results
obtained using the other method. Consequently,
ordinary regression analysis is usually not an appro-
priate regression technique for a method comparison
study. Instead, one must use a linear regression
technique that takes into account variability in the
measurement of the x variable. One such “errors-in-
variables” technique is the Deming method (Strike
1996). It has been found to be among the most
reliable of the errors-in-variables linear regression
techniques (Wakkers
et al.
1975, Riggs
et al.
1978,
Linnet 1993). Weighted regression modifications of
the Deming method are available for data sets in
which the variance of the data pairs is not constant
over the range of measurement (Riggs
et al.
1978,
Linnet 1990, 1993). The modification developed by
Linnet applies to data sets in which the variance
increases proportionally with analyte concentration.
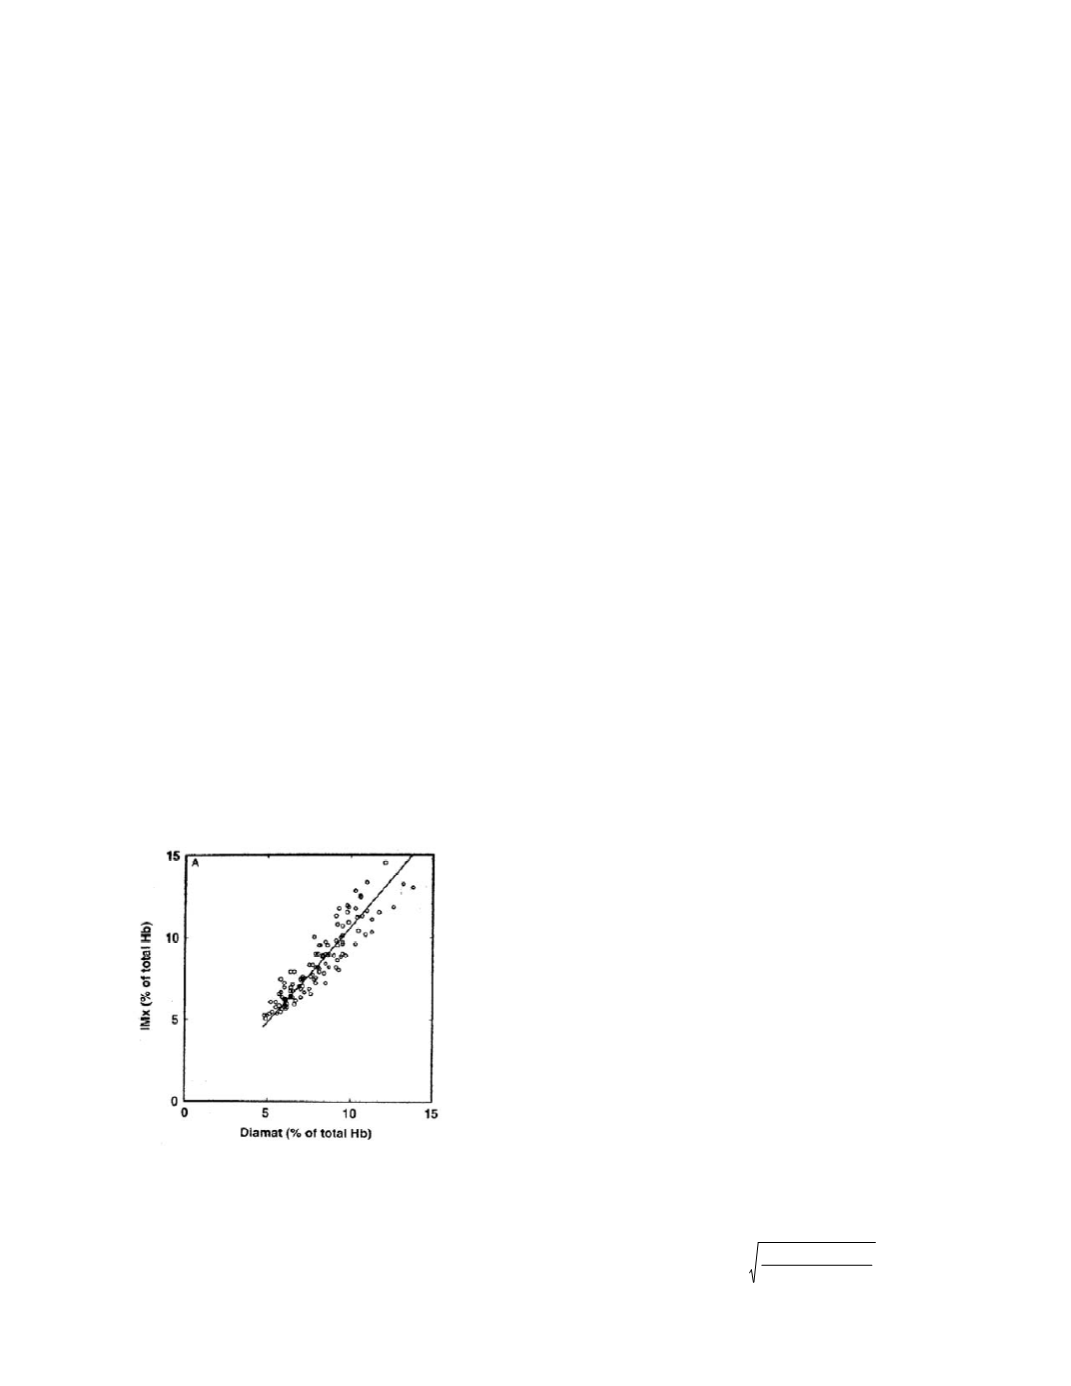
Turpeinen
et al.
present graphs of the data and
regression lines for each of the three method
pairings. For the IMx and Diamat method pairing
the graph is:
The authors found that the IMx and Diamat
methods showed the best result concordance by (un-
weighted) Deming regression (note that the authors
have been careless in their terminology, when they
write “correlation” they mean “regression”),
The correlation between IMx, calculated as
%HbA
1c,
and the Bio-Rad Diamat (Fig 2A)
gave the following results: IMx = 1.16
Diamat - 0.98 (
r
= 0.922). The good correla-
tion is explained by the fact that the IMx assay
has been standardized with an ionexchange
HPLC method, with the Diamat assay as a
secondary reference HPLC system maintained
in close calibration to the primary reference
HPLC assay.
The 95% confidence intervals on the estimates
of the slope and intercept are 1.152 to 1.170 and
-0.986 to -0.980, respectively. The confidence
interval for the slope does not include 1 so the
estimate is statistically different from 1. The confi-
dence interval for the intercept does not include 0 so
it is statistically different from 0. As neither
parameter is equal to the value expected of perfect
concordance, bias is present. When the intercept is
not 0, the data are said to show constant bias. When
the slope is not equal to 1, the data show propor-
tional bias. When both parameters do not equal
their ideal values, as here, the bias is referred to as
mixed constant and proportional. The paper states
the confidence limits for the slope and inter-
cept values were calculated with the jackknife
method
The jackknife method is a nonparametric technique
for generating empirical likelihood distributions for
the parameters of a statistical model (Mooney and
Duval 1993). In this case, the statistical model is a
line and the parameters are its slope and intercept.
The jackknife method has been found to be a reliable
way to calculate the parameter confidence intervals
when either unweighted or weighted Deming regres-
sion is used (Linnet 1993). Parametric approaches
for the calculation of the confidence intervals can be
used if the methods have relatively constant variabil-
ity over the clinical range of values for the analyte.
Calculation of the exact confidence intervals is
complex (Creasy 1956) but highly accurate, simple
approximations are available (Strike 1996). The
approximate confidence interval for the slope is,
b1 ± t
c
standard error of b1
in which
standard error of b
1=
b
1
2
(
1
−
r
2
)
/
r
2
n
−
2
Laboratory Methods
2-25


