added to a clinical sample and the increment in
analyte concentration as measured by the method is
compared to the increment in concentration calcu-
lated from the sample volume and amount of analyte
added. The comparison is usually expressed in
terms of the percentage recovery,
recovery =
measured concentration increment
predicted concentration increment
%
100%
Using multiple aliquots of a clinical sample with a
low initial analyte concentration, a number of recov-
ery samples of varying final concentrations are
made. The concentrations should span the proposed
range of measurement of the method. Between 5
and 10 between-run replicate determinations are
performed on each of the recovery samples and the
average recovery at each addition level is calculated.
Luque de Castro
et al.
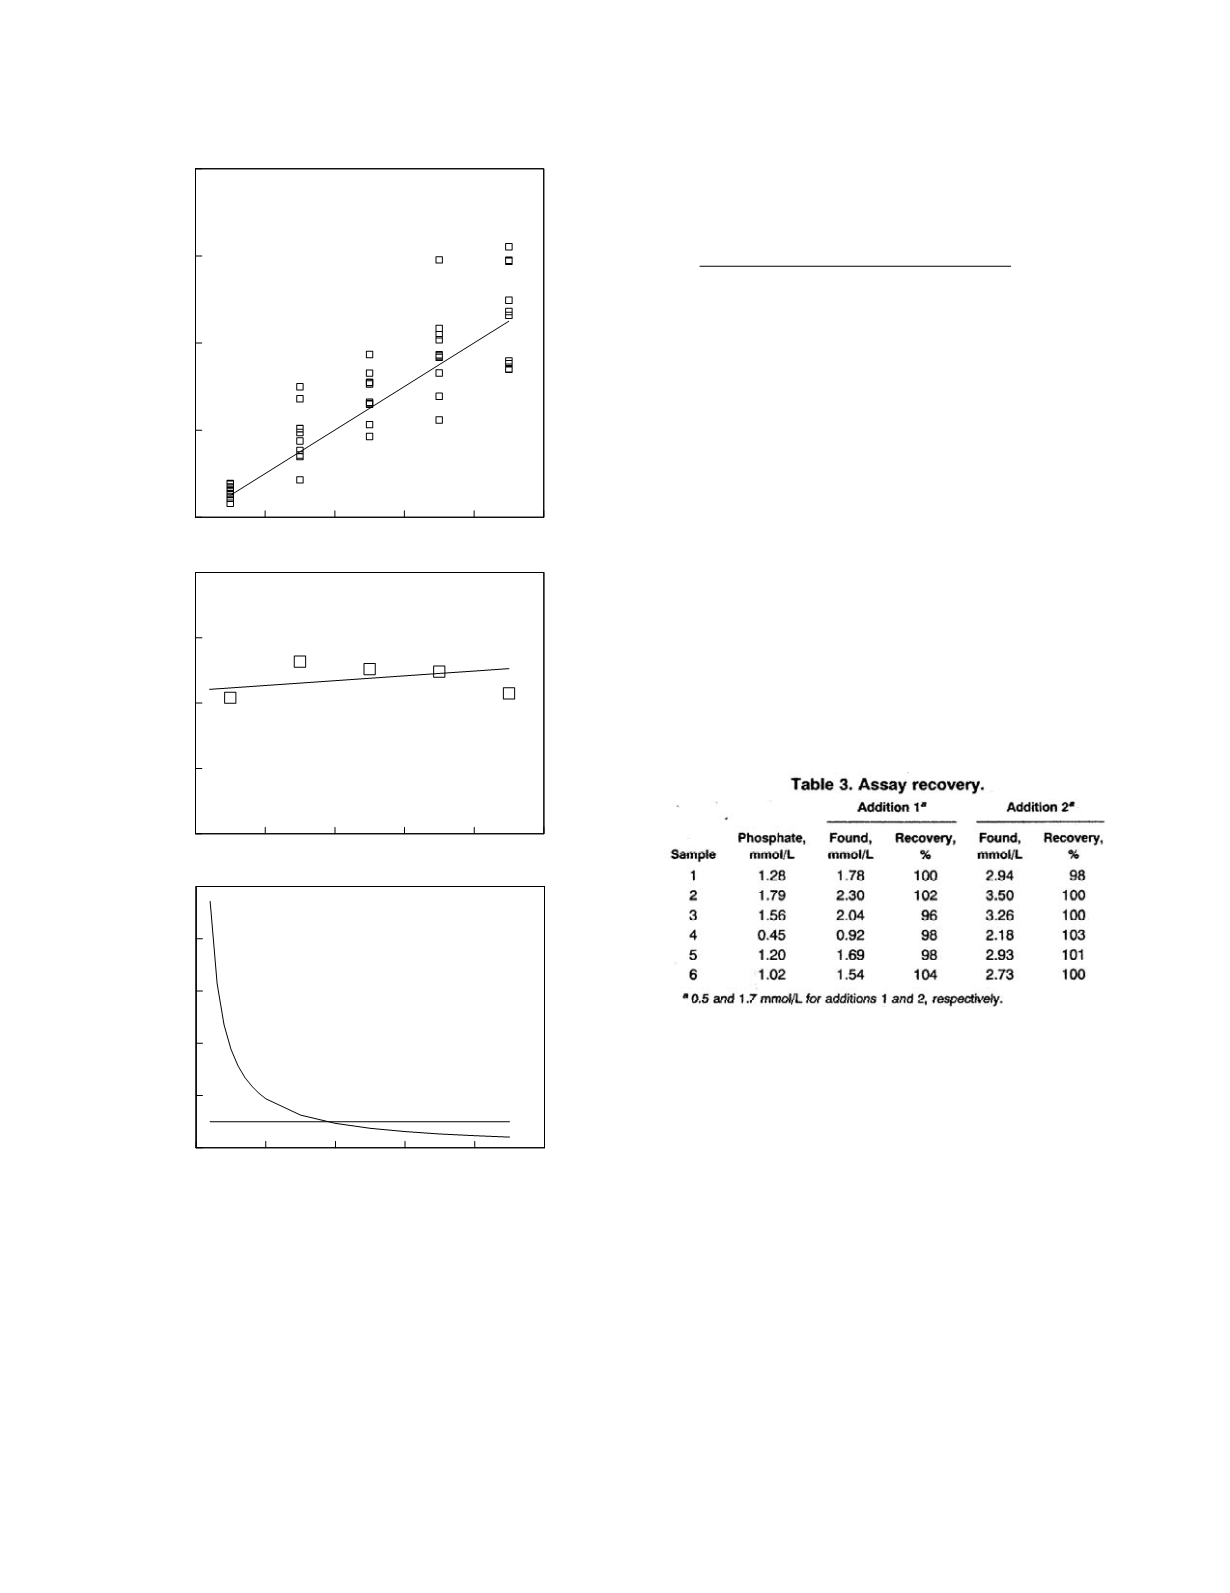
used a recovery study to
evaluate trueness in their method evaluation,
Two aliquots of six samples were subjected to
additions of standards (0.5 and 1.7 mmol/L)
to establish the recovery of the method. The
results obtained (Table 3) ranged from 96% to
104%, which represent a good recovery for
the supplemented samples.
There are two potential problems with recovery
studies that should be kept in mind. First, the calcu-
lated increment in concentration in a recovery
sample is subject to error due to possible errors in
the amount of analyte added or in the measurement
of the volume of the sample. Second, unless a clini-
cal sample with a very low analyte concentration can
be found, the trueness of the method is studied only
in the higher concentration range (initial analyte
concentration plus added analyte concentration).
Cross-reactions and interferences.
Method
trueness is also evaluated by studying the effects of
potential interfering and cross-reacting substances.
Usually the substances are studied one at a time.
The potential interferent or cross-reactant is added to
a clinical sample and the change in the analyte
concentration is measured. The effects of the
Laboratory Methods
2-19
0
10
20
30
40
50
0
20
40
60
80
Measured analyte concentration
0
10
20
30
40
50
-10
-5
0
5
10
Bias
bias = 0.977 + 0.037 concentration
0
10
20
30
40
50
Analyte concentration
0
20
40
60
80
100
Relative bias (%)
Figure 2.7
The bias of a hypothetical laboratory method.
The top graph shows replicate measurement data (symbols)
and the line of identity. The middle graph shows the empiri-
cal biases (symbols) and the linear model fit (line). The
bottom graph shows the relative bias profile (curve) and a
bias criterion (line).


