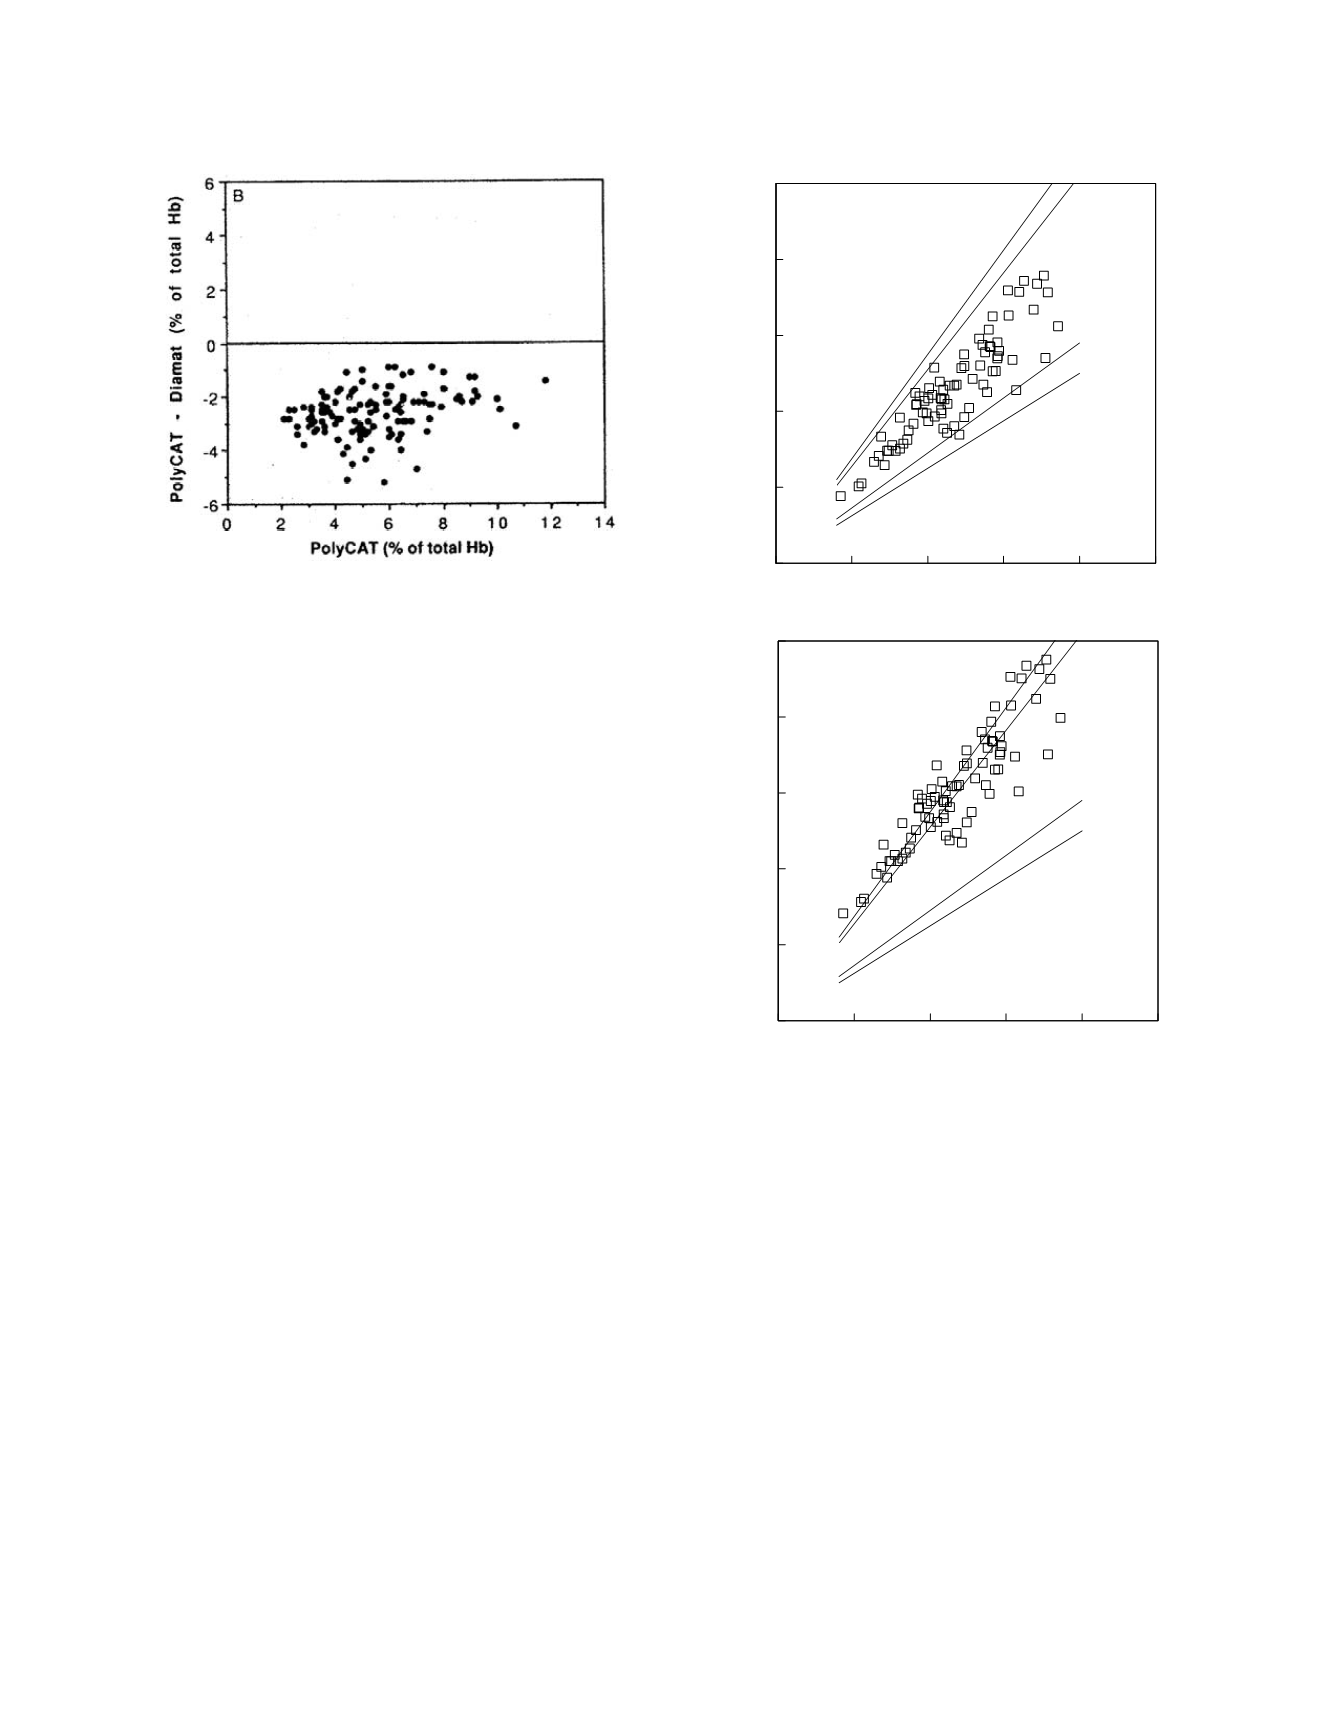
Here the bias is clear. The authors comment:
The differential plots show that the negative
bias of ~ 2-3% of total BB is seen at all
values of HbA
1c
when PolyCAT A is
compared with Diamat
Assessment of clinical equivalence
As stated earlier, clinical equivalence of two
analytical methods means that they can be used inter-
changeably. In practical terms, clinical equivalence
means two things: that the results of the two
methods show a high degree of concordance and that
the reference ranges for the measured analyte, as
determined using the two methods, are essentially
identical. The degree of concordance and the close-
ness of the agreement of the reference ranges that
are required in order to consider two method clini-
cally equivalent are matters of clinical judgment
which may be codified in recommendations promul-
gated by professional societies or in standards
imposed by regulatory agencies. Statistical evidence
is important in coming to this decision but it is not
the only consideration. For instance, the confidence
interval for the estimate of the intercept of the
regression line for paired results may indicate that it
is statistically different from zero. This indicates the
presence of a bias in the methods. However, the
magnitude of the bias may be considered to be clini-
cally insignificant and the results of the methods
deemed to be highly concordant.
Figure 2.9 demonstrates a graphical approach
for judging if two methods are clinical equivalent in
terms of the degree of concordance of the methods.
In this figure the data pairs have been plotted as they
would be for a regression analysis. The lighter,
inner lines demarcate the region in which 95% of the
data pairs will be if the methods are, on average,
perfectly concordant. Because each sample is only
measured once by each method in the usual method
comparison, individual method measurement varia-
bility results in less than perfect concordance even if
the methods are, on average, perfectly concordant.
If each sample were measured repeatedly by each
method, the average result values obtained by two
methods that were, on average, perfectly concordant
would show exact agreement. These boundary lines
are constructed using the formula,
range = analyte concentration
±
z
c
SD
result pairs
Laboratory Methods
2-27
0
25
50
75
100
125
Method 1 result
0
25
50
75
100
125
Method 2 result
0
25
50
75
100
125
Method 1 result
0
25
50
75
100
125
Method 2 result
Figure 2.9
Two sets of hypothetical method comparison
data. The data are shown as symbols. Clinical equivalence
boundary lines are indicated.


