for testing with transferrin saturation, shows that in
patients with transferrin saturations between 6 and
10% the likelihood ratio of iron deficiency is 1.57.
Using the likelihood ratio form of Bayes' formula
(Albert 1982),
P
[
post
] =
P
[
pre
]
likelihood ratio
P
[
pre
]
likelihood ratio
+ (
1
−
P
[
pre
])
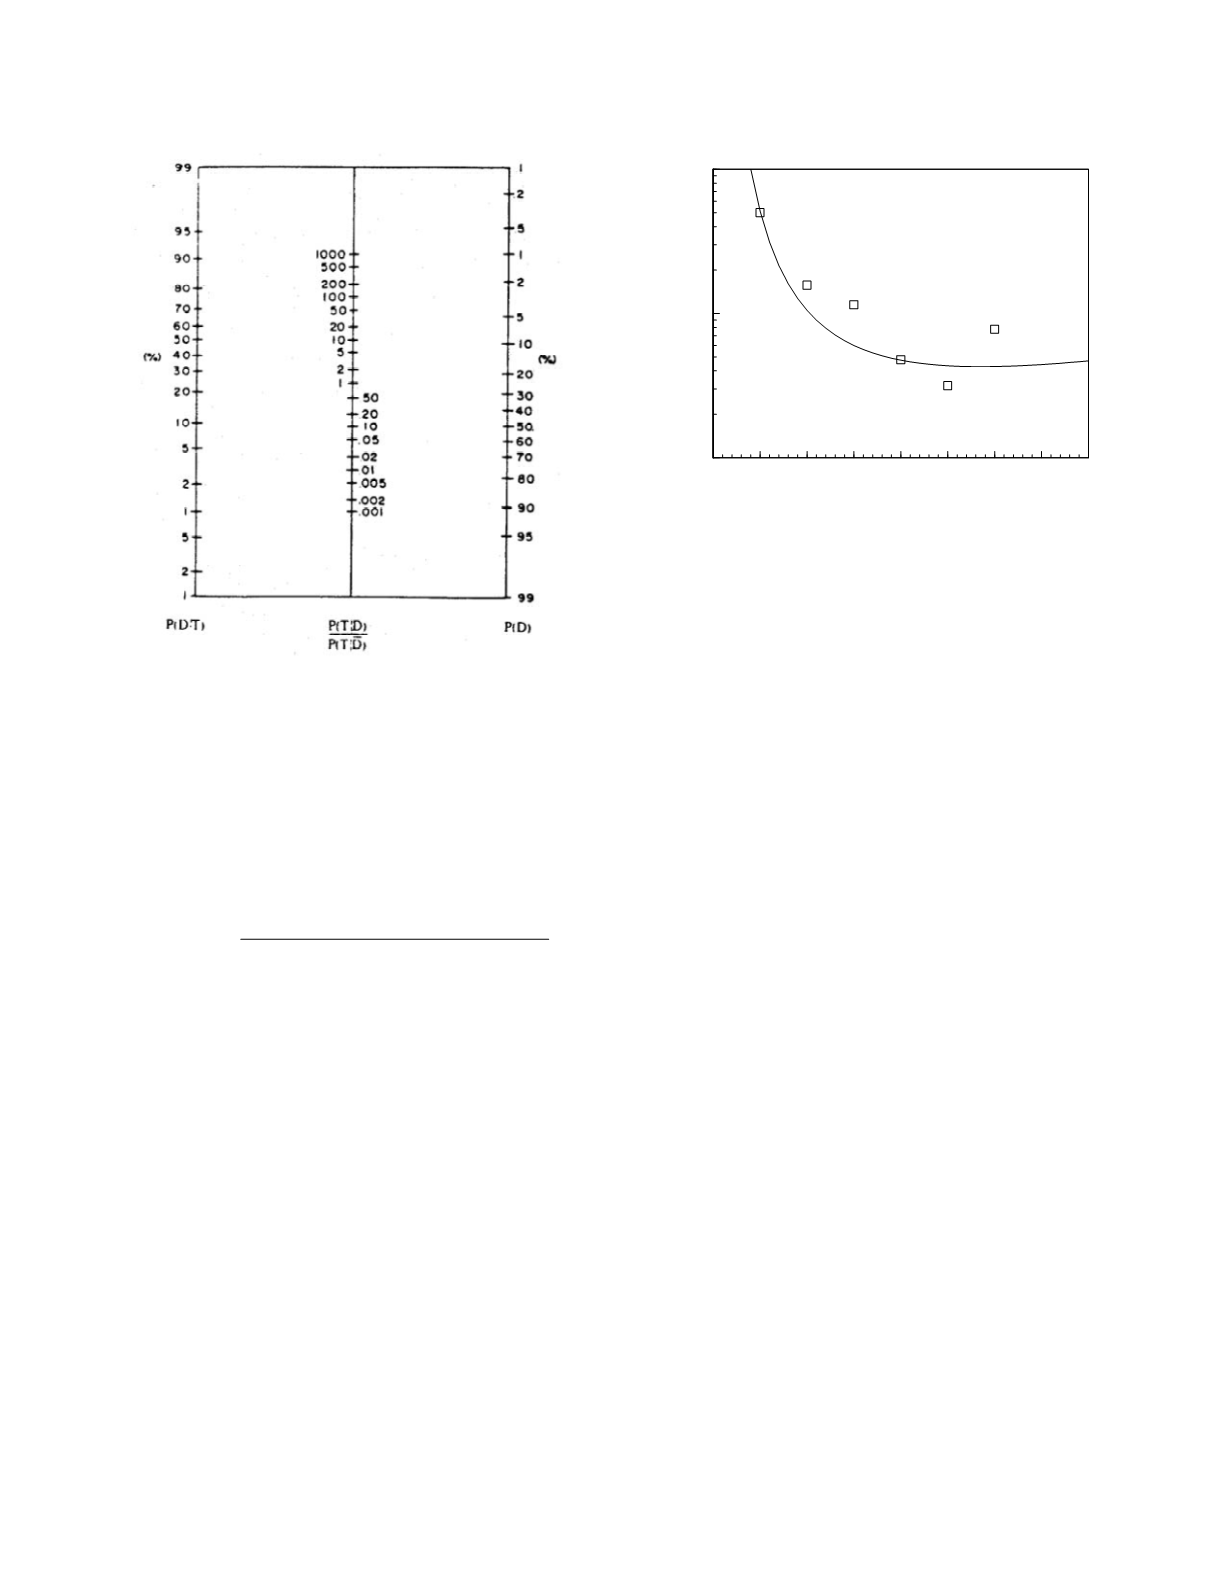
or the nomogram shown in Figure 3.9 (taken from
Fagan 1975), the posterior probability of iron
deficiency in the patient is 0.46. This estimate is
lower than the one obtained from dichotomous inter-
pretation of the study result. It is also more
accurate. It quantitatively reflects the fact that a
transferrin saturation in the range 6 to 10% occurs
with only a slightly greater frequency in patients
with iron deficiency than in patients who are not iron
deficient, 33 percent versus 21 percent, respectively.
This very relevant diagnostic information is lost
when the study results are interpreted simplistically,
in a dichotomous fashion, resulting in too high an
estimate of the posterior probability of disease.
When likelihood ratios are derived from continu-
ous distribution models of the frequency data the
ratios take on a continuous range of values. This is
illustrated in Figure 3.10 (line) which shows the
likelihood ratio for iron deficiency as a function of
transferrin saturation. The ratios have been calcu-
lated using lognormal distribution models of the
frequency data of Dallman
et al.
(1981). Also
shown on the figure (squares) are the empirical
likelihood ratios derived from the reference
frequency histograms. The likelihood ratio for a
transferrin saturation of 7.5%, as determined using
the model-based curve, is 1.88 which yields a poste-
rior probability of iron deficiency of 0.50 for the
example patient. This estimate is more accurate than
that based on the empirical likelihood ratio because
the empirical estimates are derived from binned data
(all results between 6 and 10%).
Remember that likelihood ratios will usually
vary widely among different reference populations.
Careless application of a likelihood ratio that is not
appropriate to the actual clinical situation can be
expected to result in erroneous posterior probability
calculations and subsequent diagnostic inaccuracy.
Multiple study results.
Clinicians rarely limit
diagnostic testing to a single study. Instead, multi-
ple studies are usually used. The clinical challenge,
therefore, is the interpretation of a series or combi-
nation of study results.
Serial study interpretation will be discussed first
because diagnostic evaluation most often proceeds in
a sequential fashion. First, certain facts are uncov-
ered by the history and physical; next, the results of
the preliminary laboratory studies are obtained; and
then, over a period of hours to weeks, the results of
additional laboratory studies ordered by the clinician
Diagnostic and Prognostic Classification
3-10
0 5 10 15 20 25 30 35 40
Transferrin saturation (%)
0.1
1
10
Likelihood ratio of iron deficiency
Figure 3.9
Nomogram for Bayes' formula. P(D), prior
probability; P(T/D)/P(D/T), likelihood ratio; P(D/T), posterior
probability. Reprinted from Fagan TJ. 1975. Nomogram
for Bayes' theorem. N Engl J Med 293:257.
Figure 3.10
The likelihood ratio of iron deficiency as a
function of transferrin saturation. The squares represent the
points constructed from the observed frequency data
(Figure 3.1). The continuous line is the curve constructed
from the lognormal frequency distribution models of the
data.


