future. As both of these uses for prognostication
represent exercises in clinical classification, it is
possible to describe the performance of prognostic
studies to a large extent using the same techniques
that have been developed to characterize diagnostic
classification.
In diagnostic classification, the fundamental
measures of performance are sensitivity and specific-
ity. Because there may be more than two prognostic
categories and because outcome and risk categories
are not necessarily as antithetical as the diagnostic
categories of disease and free from disease, terms
other than sensitivity and specificity need to be
employed to measure performance in prognostic
classification. Unfortunately, no distinctive terms
have been invented for this purpose. Instead, the
utilitarian phrase, fraction correctly classified, will
be used here to quantify the fraction of individuals
belonging to a prognostic group who are correctly
placed into that group by the results of the laboratory
study.
The prognostic group into which an individual is
classified is determined by the study result for the
individual and the study's critical values. When
there are only two prognostic categories, there will
be a single critical value. If the study result is
smaller than the critical value, the individual will be
assigned to one of the prognostic groups and if the
result is larger than the critical value he or she will
be assigned to the another. Because any study result
can potentially function as the critical value, the
comprehensive description of the classification
performance of the study requires a listing of the
fractions correctly classified for every possible
choice of critical value. This is conveniently done
graphically by means of a performance characteristic
curve, i.e., a ROC curve.
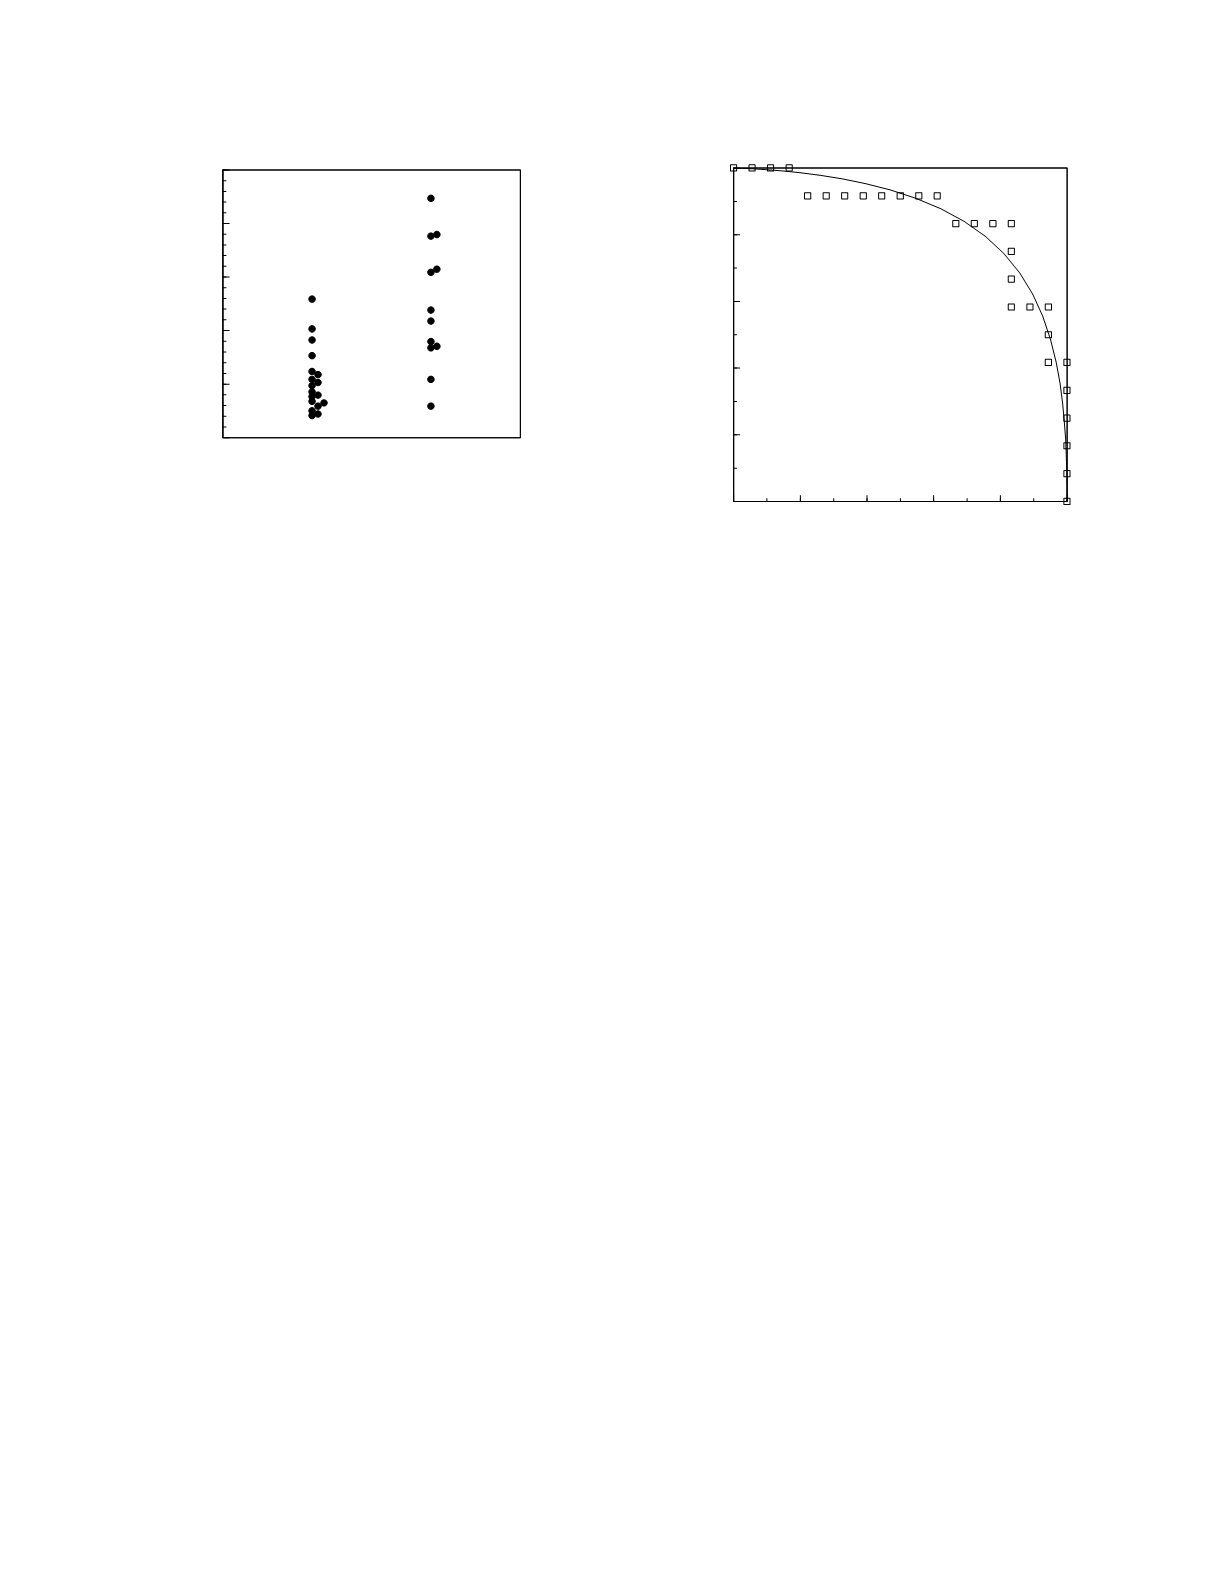
For example, in a study comparing the prognos-
tic performance of acetaminophen half-life and the
14
C-aminopyrine breath test as outcome predictors in
acute acetaminophen poisoning, Saunders
et al.
(1980) report the acetaminophen half-lives shown in
Figure 3.14. As pictured here, the good prognosis
group consists of those patients who had either no
liver damage or mild to moderate liver damage as a
consequence of the drug overdose. The poor
prognosis group is made up of those patients who
either died acutely or who had severe liver damage.
The ROC curve for these data is shown in Figure
3.15.
Multiple prognostic categories
When there are more than two prognostic
categories, more than one critical value is necessary;
the number being one less than the number of
categories. Hence, two values are required to
separate three categories: one value indicates the
separating line between the good prognosis group
and the intermediate prognosis group and the second
value delimits the intermediate and poor prognosis
groups. A complete description of the performance
of the study as a prognostic classifier in this case
requires tabulation of the fraction correctly classified
for each of the prognostic categories for every
Diagnostic and Prognostic Classification
3-16
Prognostic category
0
5
10
15
20
25
Acetaminophen half-life (h)
poor
good
0
0.2
0.4
0.6
0.8
1
Fraction correctly classified
Good prognosis group
0
0.2
0.4
0.6
0.8
1
Fraction correctly classified
Poor prognosis group
Figure 3.15
ROC curve for acetaminophen half-life. The
squares represent the points constructed from the observed
data. The continuous line is the curve constructed from
frequency distribution models of the data.
Figure 3.14
Individual values of acetaminophen half-life in
acute acetaminophen poisoning with data sorted into two
prognostic categories.


