possible choice of critical value pairs. This
produces a trivariate data set that can be represented
graphically as a three-dimensional ROC surface.
Returning to the example from Saunders
et al.
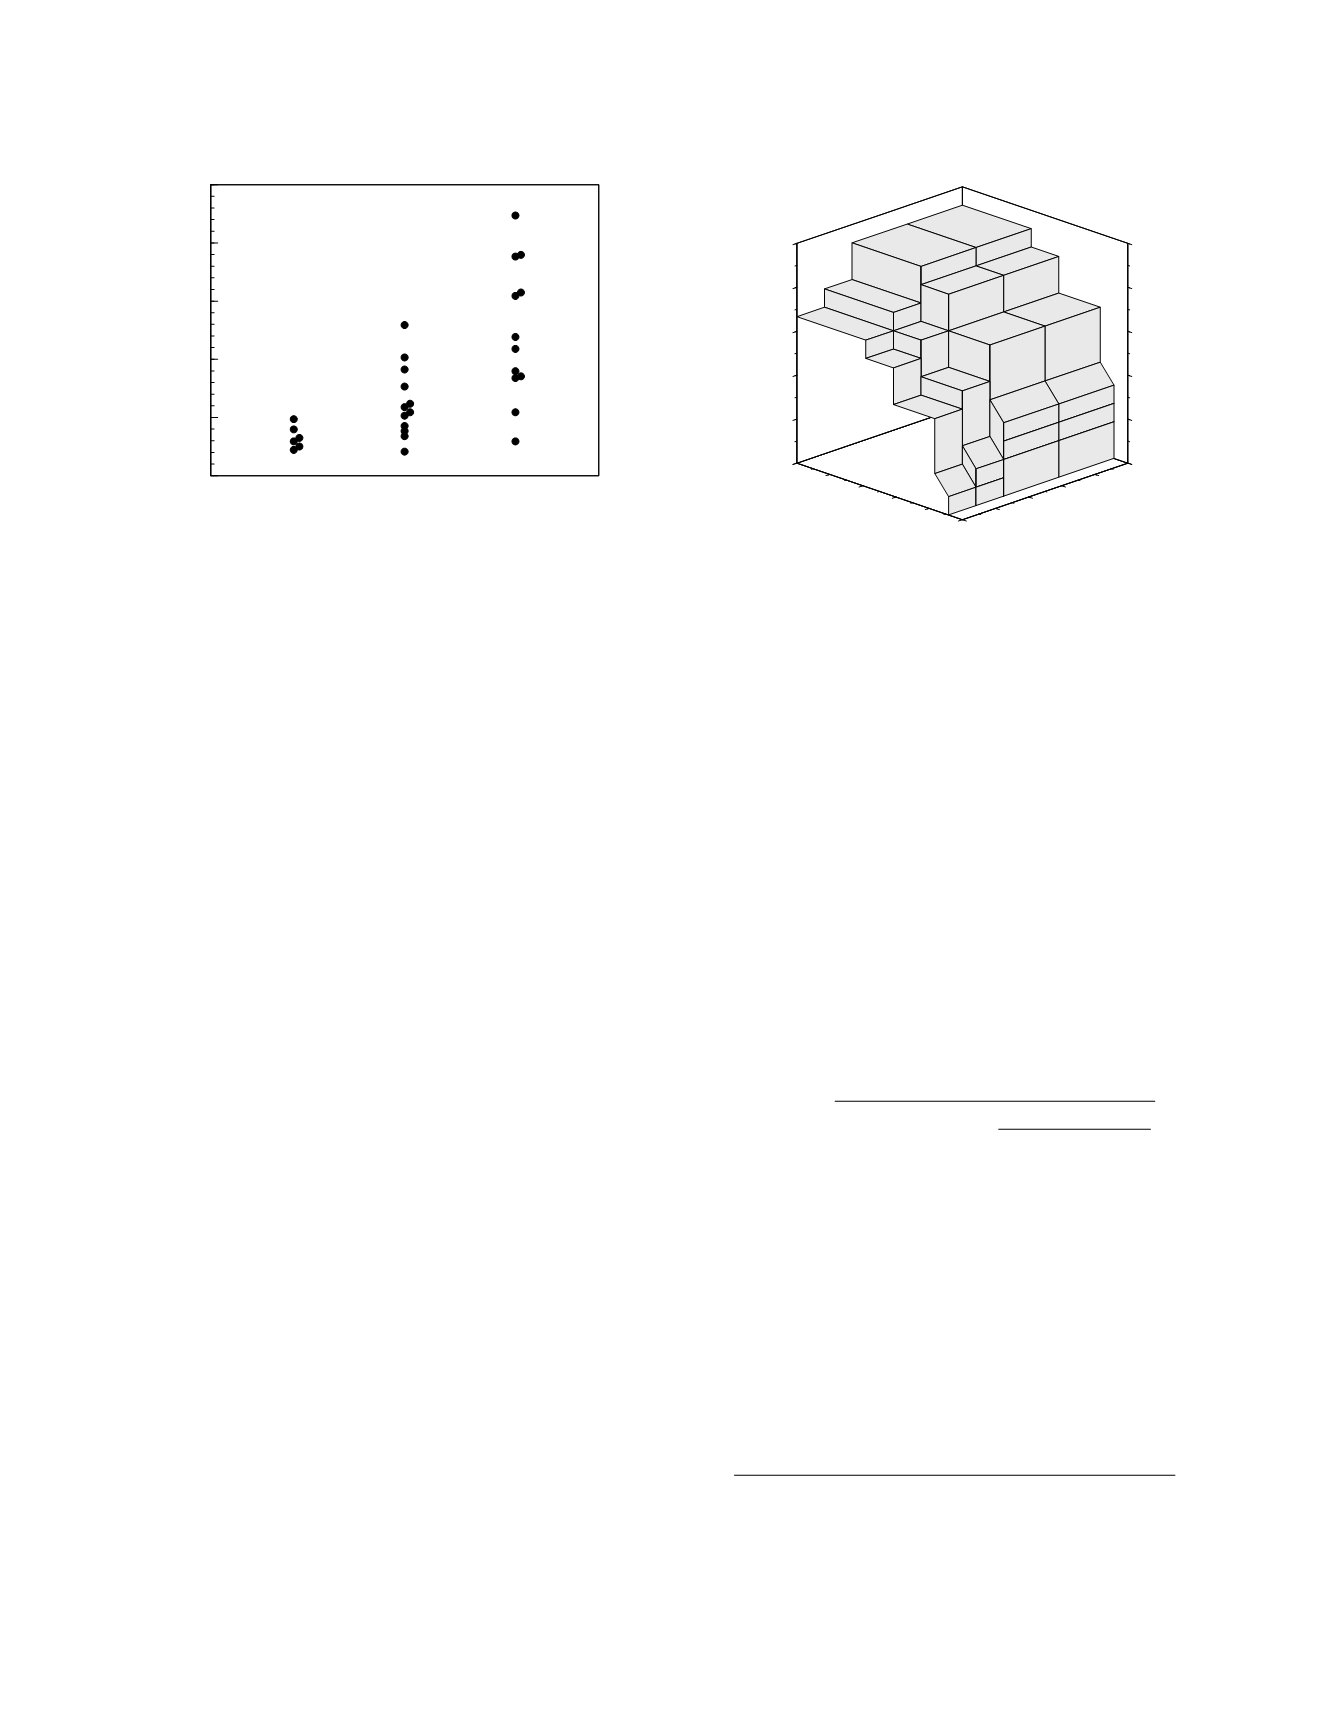
(1980), consider the classification performance of
acetaminophen half-life when three prognostic
groups are defined—a good prognosis group, here
consisting of patients who had no liver damage, an
intermediate prognosis group composed of patients
with mild to moderate liver damage, and a poor
prognosis group made up of patients who had severe
liver damage or who died acutely. The acetamino-
phen half-life data arranged according to this catego-
rization of outcomes is shown in Figure 3.16 and the
empirical ROC surface is shown in Figure 3.17.
Just as there are measures of diagnostic perform-
ance that incorporate disease prevalence, there are
measures of prognostic performance that reflect the
quantitative effects of prognostic category
prevalence. The most important of these measures
is prognostic efficiency, the fraction of individuals in
a clinical population who will be correctly classified
by the use of a prognostic study,
efficiency
=
FCC
i
$
prevalence
i
where
FCC
i
is the fraction correctly classified for
prognostic category
i
and the summation is carried
out over all the prognostic categories.
THE PROGNOSIS IN AN INDIVIDUAL
Prognoses are not like diagnoses. It is not
necessary to eventually assign a patient to one or
another prognostic group. Instead, it is enough to
know, and let the patient know, the relative
probabilities of being in each of the relevant
prognostic groups. For instance, a clinician does not
tell a patient “your cancer will recur” even though
the probability of having a recurrence is greater than
the probability of remaining recurrence-free.
Instead, the patient may be told, “There is a 75
percent chance that you will have a recurrence of
your tumor within 5 years.”
The probability of an individual patient belong-
ing to a particular prognostic group can be calculated
using Bayes' formula. The best way to make the
calculation is by using likelihood ratios, in which
case (Birkett 1988),
P
j
[
post
] =
prevalence
j
prevalence
j
+
i
!
j
prevalence
j
likelihood ratio
ji
where
P
j [post]
is the posterior probability of being in
the
j
th prognostic category and
likelihood ratio
ji
is
the frequency of the study result in group
j
divided
by the frequency in group
i
. The summation is
carried out over all the prognostic categories except
category
j
. If there are only two prognostic catego-
ries, the preceding formula has the more familiar
appearance,
P[post] =
prevalence
$
likelihood ratio
prevalence
$
likelihood ratio
+ (
1
−
prevalence
)
Figure 3.18 (left graph) shows the likelihood ratio of
a good outcome in acute acetaminophen poisoning as
a function of the acetaminophen half-life as
Diagnostic and Prognostic Classification
3-17
Prognostic category
0
5
10
15
20
25
Acetaminophen half-life (h)
poor
good intermediate
0
0.2
0.4
0.6
0.8
1
0
0.2
0.4
0.6
0.8
1
0
0.2
0.4
0.6
0.8
1
0
0.2
0.4
0.6
0.8
1
Fraction correctly classified
Intermediate prognosis group
Fraction correctly classified
Poor prognosis group
Fraction correctly classified
Good prognosis group
Figure 3.16
Individual values of acetaminophen half-life in
acute acetaminophen poisoning with data sorted among
three prognostic categories.
Figure 3.17
Empirical ROC surface for acetaminophen
half-life used to classify three prognostic groups.


