parameters, the slope and the intercept, so two
concentrations should be evaluated. The optimal
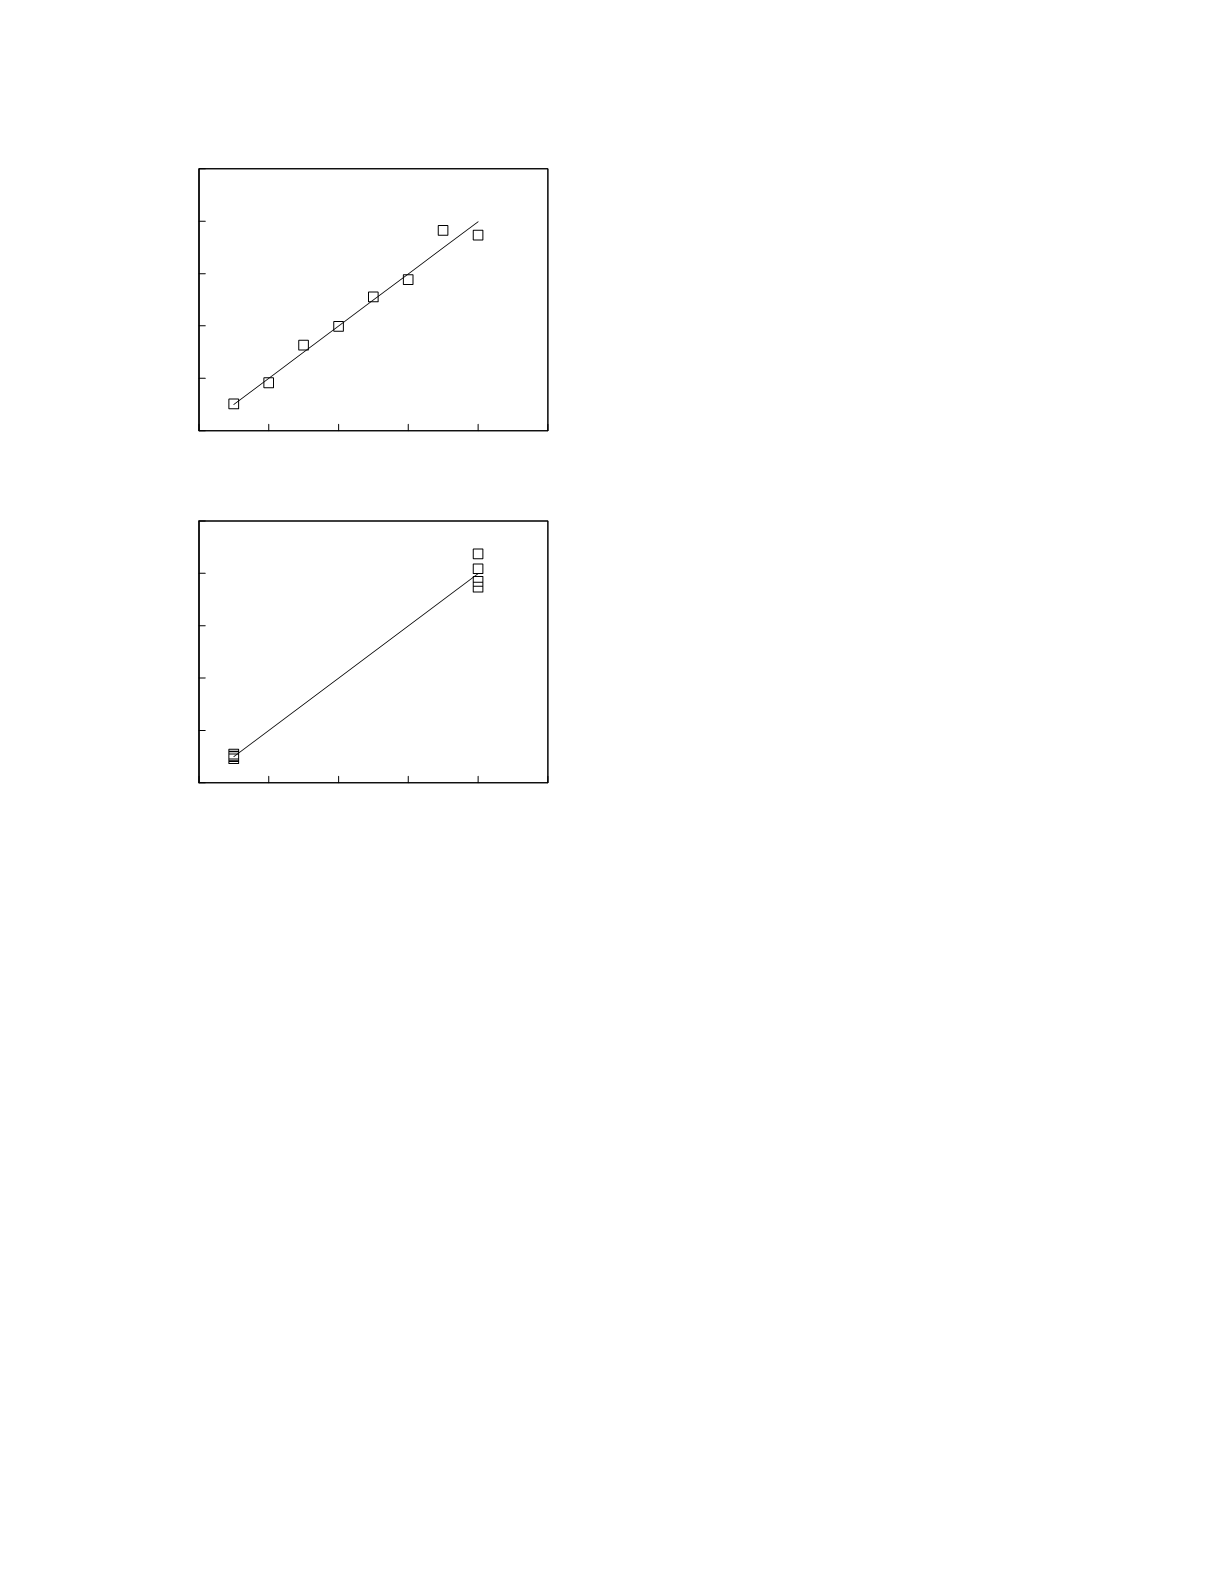
concentrations are the concentrations at each end of
the range of measurement. Figure 2.2 illustrates a
simulated application of this optimal design. The
hypothetical linear calibration relationship has an
intercept of zero and a slope of two and proportional
measurement variability. Using a scheme in which
the calibrators are evenly spaced over the clinical
range results in the parameter estimates shown in the
upper graph. Using the optimal scheme (lower
graph) with the same number of calibrators gives
parameter estimates that are closer to the true
(simulation) values. An added benefit of the end-of-
range calibrator spacing scheme is that the incon-
stancy of the measurement variability is much more
clearly demonstrated than with the even spacing
scheme. Optimal spacing schemes can also be
devised for more complex equations such as those
for immunoassays (Bezeau and Endrenyi 1986).
Ordinary linear regression is the technique most
frequently used for the estimation of the parameter
values of linear calibration curves. This technique
has an underlying assumption: the variability in the
measurement of the dependent variable has a
constant variance (Berry 1993). If the variability in
the measurement of the analytical signal is not
constant over the range of calibrator concentrations
employed, weighted linear regression analysis,
which adjusts for the inconstancy in the variability of
measurement, should be used instead.
Nonlinear regression analysis is the most
accurate and precise technique of parameter estima-
tion for nonlinear curves (Motulsky and Ransnas
1987). It is the technique that is used to estimate the
parameters of the sigmoidal calibration curves found
in immunoassay systems
THE METHOD OF MEASUREMENT
Most measurements can be performed in a
number of ways that vary in the nature of the
sample, the technique of analyte separation, the
means of producing and detecting the analytical
signal, and the technique for calculating results. A
specific way of performing a measurement is
referred to as a method of measurement or, infor-
mally, as a laboratory method or, more simply still,
as a method. Laboratory methods are the basic units
of laboratory practice.
METHOD QUALITY
The quality of a laboratory method can be
defined as the ability of the method to satisfy the
clinical needs served by measurements made with
the method. There is always a need for trueness and
precision.
Trueness of measurement
Trueness is defined as the closeness of agree-
ment between the true value of an analyte and the
average result value obtained from a large number of
replicate measurements (Stöckl 1996, Dybkaer
1995). It is the term that is currently applied to the
concept that used to be called accuracy. Accuracy is
now used to denote the broader concept of closeness
of agreement between the true value of an analyte
and a single measurement result. As such, accuracy
reflects both trueness and precision of measurement.
Trueness is measured on a ordinal scale of the sort:
Laboratory Methods
2-3
Figure 2.2
Calibration curves as obtained by two different
calibrator spacing schemes. The even spacing scheme is
shown in the top graph and the end-of-range spacing
scheme is shown in the bottom graph.
0
10
20
30
40
50
Calibrator concentration
0
20
40
60
80
100
Signal magnitude
0
10
20
30
40
50
Calibrator concentration
0
20
40
60
80
100
Signal magnitude
intercept = 0.053
slope = 1.994
intercept = 0.004
slope = 1.997


