respectively (nonparametric) and 80.02 and 120.68,
respectively (normal model)
The choice of the model is obviously crucial
when modeling frequency data. In the example, a
normal distribution was selected as the model and,
both by visual inspection and by statistical criteria
proved to be satisfactory. Often, though, a normal
distribution will not serve well. The frequency
distributions of most laboratory studies show appre-
ciable skew. That is, more than half of the results
occur at values to one side of the median (the value
with the maximum frequency). Such data can often
be well modeled using the lognormal distribution or
the even more generally applicable three-parameter
lognormal distribution (Royston 1992).
Reporting results
When a study result is reported to a physician it
is necessary that he or she understand what the
particular result means in terms of the medical
reason for which the study was performed. When a
study is ordered to aid in the classification of a
patient the physician will need to know how the
study result compares to the values found among
individuals in the pertinent clinical classification
category and also among individuals in complemen-
tary classification categories. It makes sense, then,
to report not only the study result itself but also its
relationship to the frequency distributions associated
with the classification categories under con-
sideration. This can be done in a number of ways
(Dybkaer and Solberg 1987). The quantitative
approach is to indicate where exactly the result falls
within the frequency distributions of study results in
the appropriate clinical reference groups. At
present, though, it is still beyond the capability of
clinical laboratories to provide this service because
of the vast number of reference groups that are of
interest to physicians ordering laboratory studies.
It is possible, however, and a practical standard,
to take the much less quantitative approach of report-
ing the usual (95%) range of study results as found
in normal individuals. This range is called the
normal range by most clinicians and the reference
range or reference interval by most laboratorians.
The identification of the members of this refer-
ence population is problematic (Solberg 1987a,
Gräsbeck 1990). What, for instance, is meant by the
inclusion criterion "normal"? And what are the
exclusion criteria for normality? Some laboratories
Laboratory-based Medical Practice
1-9
70
80
90
100
110
120
130
140
Study result
60
80
100
120
140
Study result
0
0.2
0.4
0.6
0.8
1
Cumulative frequency
60
80
100
120
140
Study result
0
0.01
0.02
0.03
0.04
0.05
0.06
Frequency
B
C
A
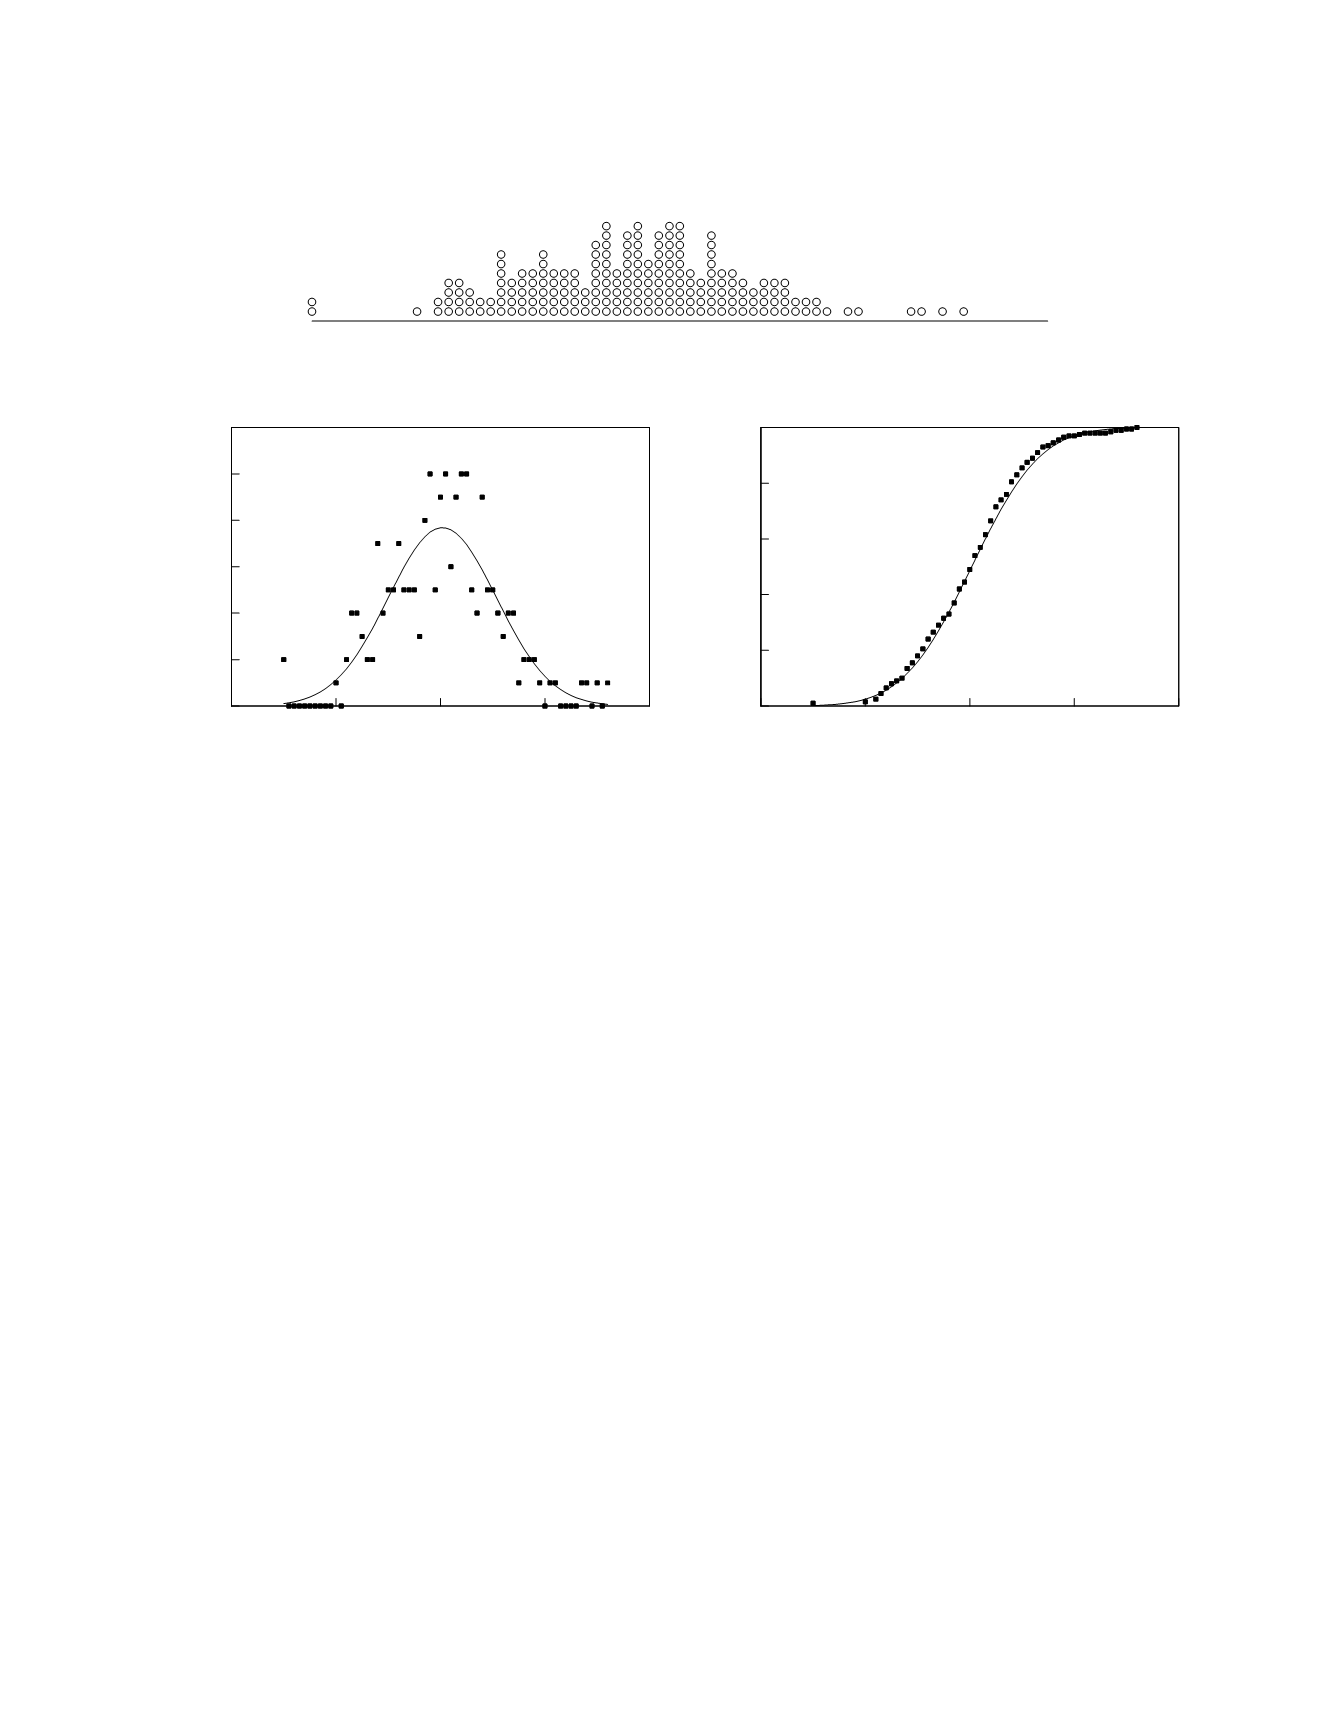
Figure 1.4
Graphical presentations of the distribution of a set of hypothetical study results.
A.
Individual values.
B.
Empirical
values (squares) and the normal, i.e., Gaussian, model (line) of the frequency density distribution.
C.
Empirical values
(squares) and the normal model (line) of the cumulative frequency distribution.


