diagnostic or prognostic classes, the predictive
values are meaningful. Studies employing properly
performed naturalistic and retrospective sampling
schemes include an epidemiologic inquiry into class
prevalence, so the reported predictive values are
valid for the site at which the evaluation was
performed. The values may not apply at other sites
because the prevalence of diagnostic or prognostic
classes can differ between locations and institutions.
The problem of varying class prevalence at
different sites also arises with classification rules
based on logistic functions. Because logistic
functions include terms for class prevalence, the
posterior probability calculations reflect the class
prevalences at the site evaluating the classification
study. The probability estimates will be erroneous
at sites where the class prevalences are different
unless the classification rules are corrected for local
class prevalence (Poses
et al.
1986, Morise
et al.
1996).
Validation
The final component of a performance evalua-
tion report is the description of the methods and
results of a validation study of the performance
findings. The most convincing way to demonstrate
the validity of the findings is to perform an identical
investigation in new group of subjects and to arrive
at the same performance estimates. This task is
usually left to other researchers. What is done
instead is to confirm the reported findings among
subjects from the original study population. This is
called cross-validation. The simplest design for a
cross-validation study, and the one most often seen
in the medical literature, is to perform the evaluation
using only some of the subjects, the training sample,
having selected them at random. The evaluation is
then repeated using the remainder of the subjects,
the validation sample. Concurrence of the perform-
ance estimates in the two groups indicates that the
findings are valid. A particularly powerful way to
demonstrate concurrence is to use the likelihood
ratio estimates derived from the training sample to
predict the probability of class membership among
the individuals in the validation sample. The
predicted probabilities are then compared to the
observed probabilities, i.e. class membership
frequencies, by plotting them as a calibration curve
(e.g., Figure 4.4). Points for the curve are gener-
ated by binning the predicted probability results into
subgroups each of which has roughly the same
number of data. If the performance estimates are
valid, the calibration curve will closely follow the
line of identity.
Another way to demonstrate the validity of a
performance evaluation is to show that the findings
do not change as a consequence of reasonable varia-
tion in the analytic and reference methods or in the
composition of the study population. Such an analy-
sis can be provided for as part of the evaluation
design, for example, by using a design that permits
calculation of the magnitude of analytic variability,
Evaluating Classification Studies
4-8
0
0.2
0.4
0.6
0.8
1
Specificity
0
0.2
0.4
0.6
0.8
1
Sensitivity
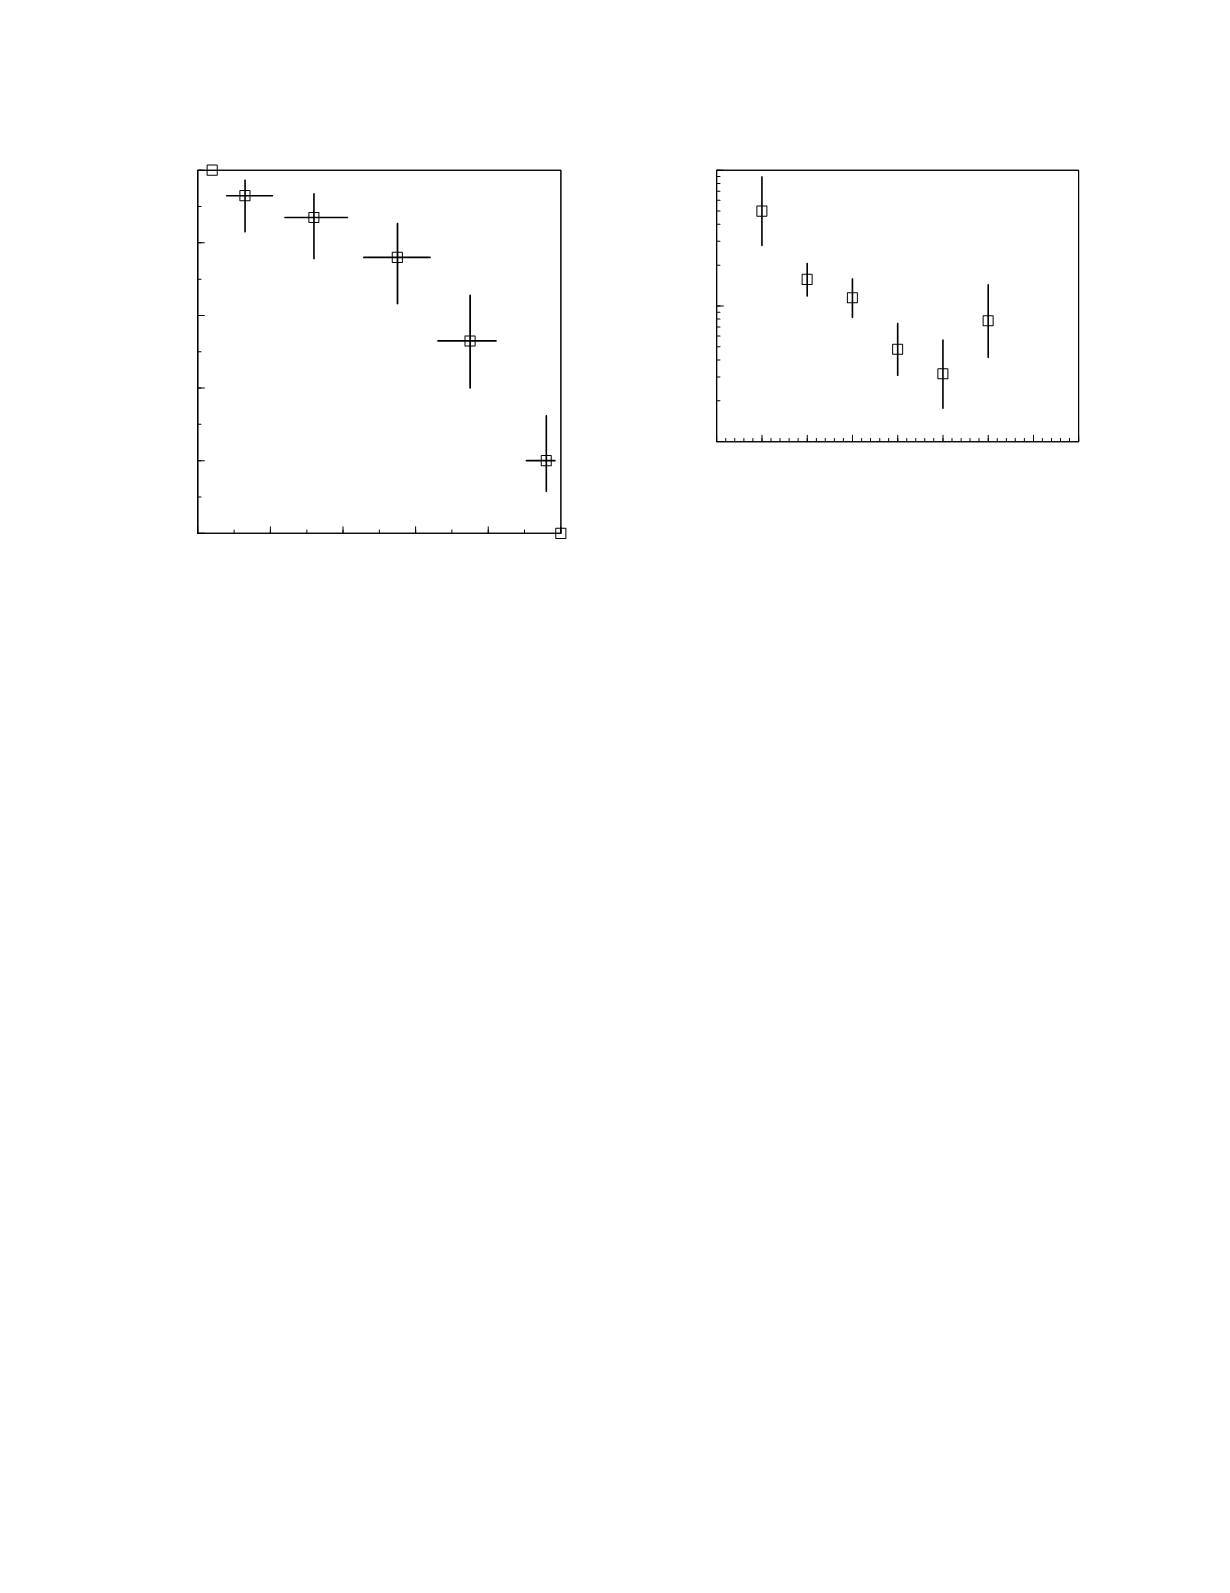
Figure 4.2
ROC curve for transferrin saturation with 95%
confidence intervals indicated. The intervals for the speci-
ficity estimates are shown as lines parallel to the specificity
axis and the intervals for the sensitivity estimates are shown
as lines parallel to the sensitivity axis.
0 5 10 15 20 25 30 35 40
Transferrin saturation (%)
0.1
1
10
Likelihood ratio of iron deficiency
Figure 4.3
The likelihood ratio of iron deficiency as a
function of transferrin saturation with 95% confidence inter-
vals indicated.


