critical value should be set equal to the value that
yields the threshold likelihood ratio for follow-up
threshold likelihood ratio for follow-up =
(
1
−
prevalence
)
P
[
rejection
]
prevalence
(
1
−
P
[
rejection
])
with the prevalence being the frequency of the
subclinical disorder among members of the
demographic group being screened at the time in life
when the screening study is performed.
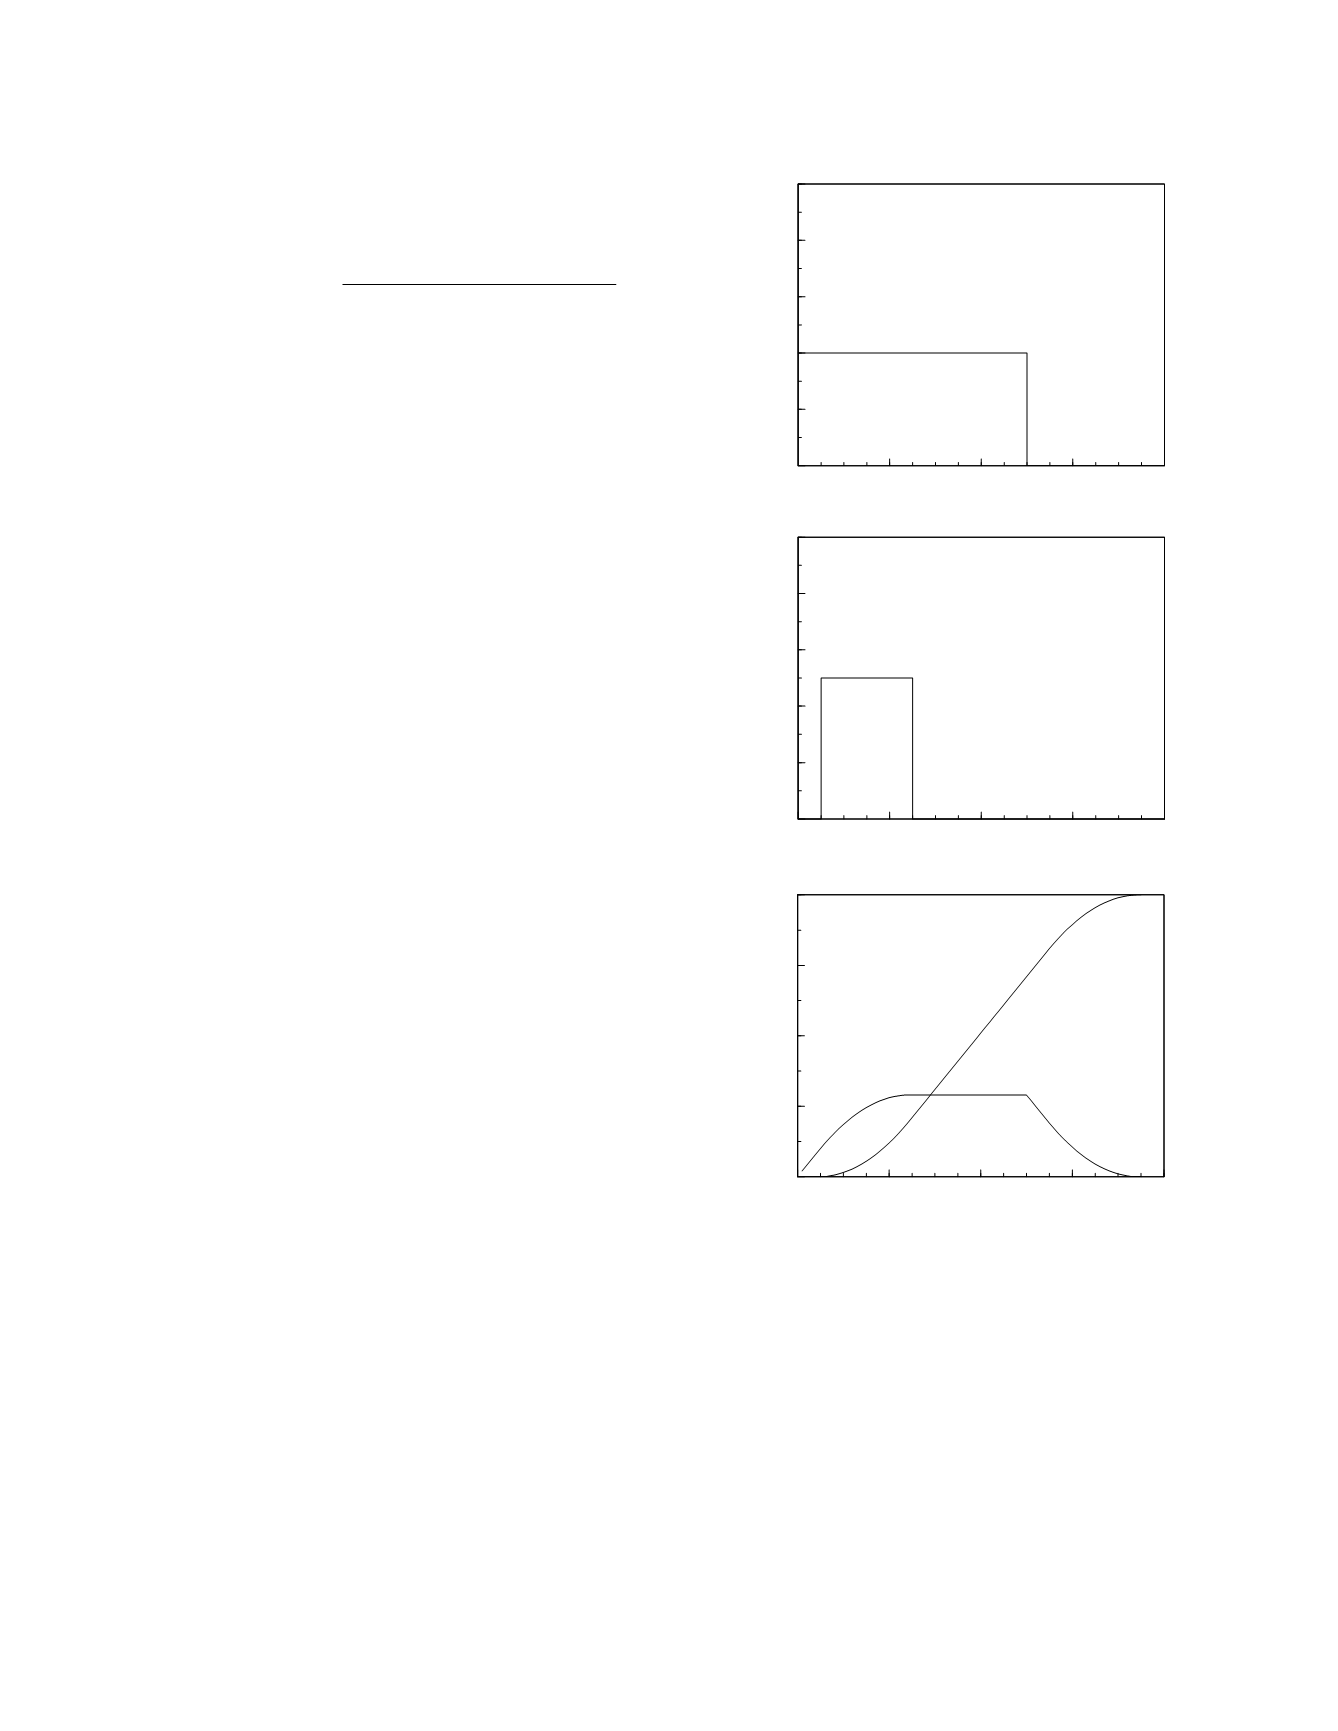
Figure 5.1 shows the details of the natural
history of a hypothetical disorder. As depicted,
there is a 10 year period in a person's life when the
disease may begin, with the risk of contracting the
disorder being constant throughout that period (top
graph). Once begun, the disease lasts 1 to 5 years in
its subclinical phase before becoming clinically
manifest with an equal frequency of clinical appear-
ance throughout that period (middle graph). The
resulting prevalence of the subclinical and clinical
phases of the disease are shown in the bottom graph.
Notice that, given the simple patterns of onset and
progression employed here, there is a 5 year period,
5 to 10 years, during which the prevalence of the
subclinical phase is constant at its maximum value,
0.0116. Clearly, it is during this period that screen-
ing should be performed in a one-study program.
So, let the time of the screening study be 5 years,
just as the prevalence plateau is reached. How many
of these subclinical cases will then be detected?
That depends upon the diagnostic performance of the
screening study which, in turn, is determined by the
natural history of the marker measured by the study
(Figure 5.2, top graph) and the distribution of the
degree of development of the subclinical phase
among the individuals with subclinical disease
(Skates and Singer 1991). The marker concentration
frequency distributions for disease-free individuals
and individuals with subclinical disease as found in
year 5 in the natural history of this hypothetical
disorder are shown in the middle graph of Figure
5.2. The bottom graph shows the associated likeli-
hood ratio plot.
If the threshold probability for rejection of the
diagnosis is 0.1, the threshold likelihood ratio for
screening follow-up is 9.5 and the appropriate criti-
cal value for the screening study is 77. This critical
value yields a test sensitivity of 0.69 and a specific-
ity of 0.996. Therefore, the sensitivity of the screen-
ing program, i.e., the probability of detecting the
disease in the subclinical phase with a single
screening study, is 0.20 (the proportion of individu-
als with disease who are screened while in the
subclinical phase, 0.29, times the single-test sensitiv-
ity of the study, 0.69). Is this expectation of detect-
ing subclinical disease large enough to be considered
reasonable? Perhaps. The expense and morbidity
generated by a screening program based on this
study may not be great and the benefits of identify-
ing even 20 percent of affected individuals during
the subclinical phase may be substantial. On the
Monitoring
5-2
Figure 5.1
The natural history of a hypothetical disorder
.
0
4
8
12
16
Time (yr)
0
0.002
0.004
0.006
0.008
0.01
Incidence (percent per year)
0
4
8
12
16
Time (yr)
0
0.1
0.2
0.3
0.4
0.5
Frequency
0
4
8
12
16
Time (yr)
0
0.01
0.02
0.03
0.04
Prevalence (percent)
clinical
cases
subclinical
cases
length of
subclnical phase


