.
significant difference
m
2 2
(
1
−
r
(
$
))
var
indiv
The next clinical situation to consider is one in
which there are a number of study results for a
patient during a period in which the patient's physi-
ologic status is believed to have been constant. If
there are six or more previous results, var
indiv
can be
calculated. The reason that at least six measure-
ments are needed is that estimates based on fewer
measurements have a high degree of uncertainty.
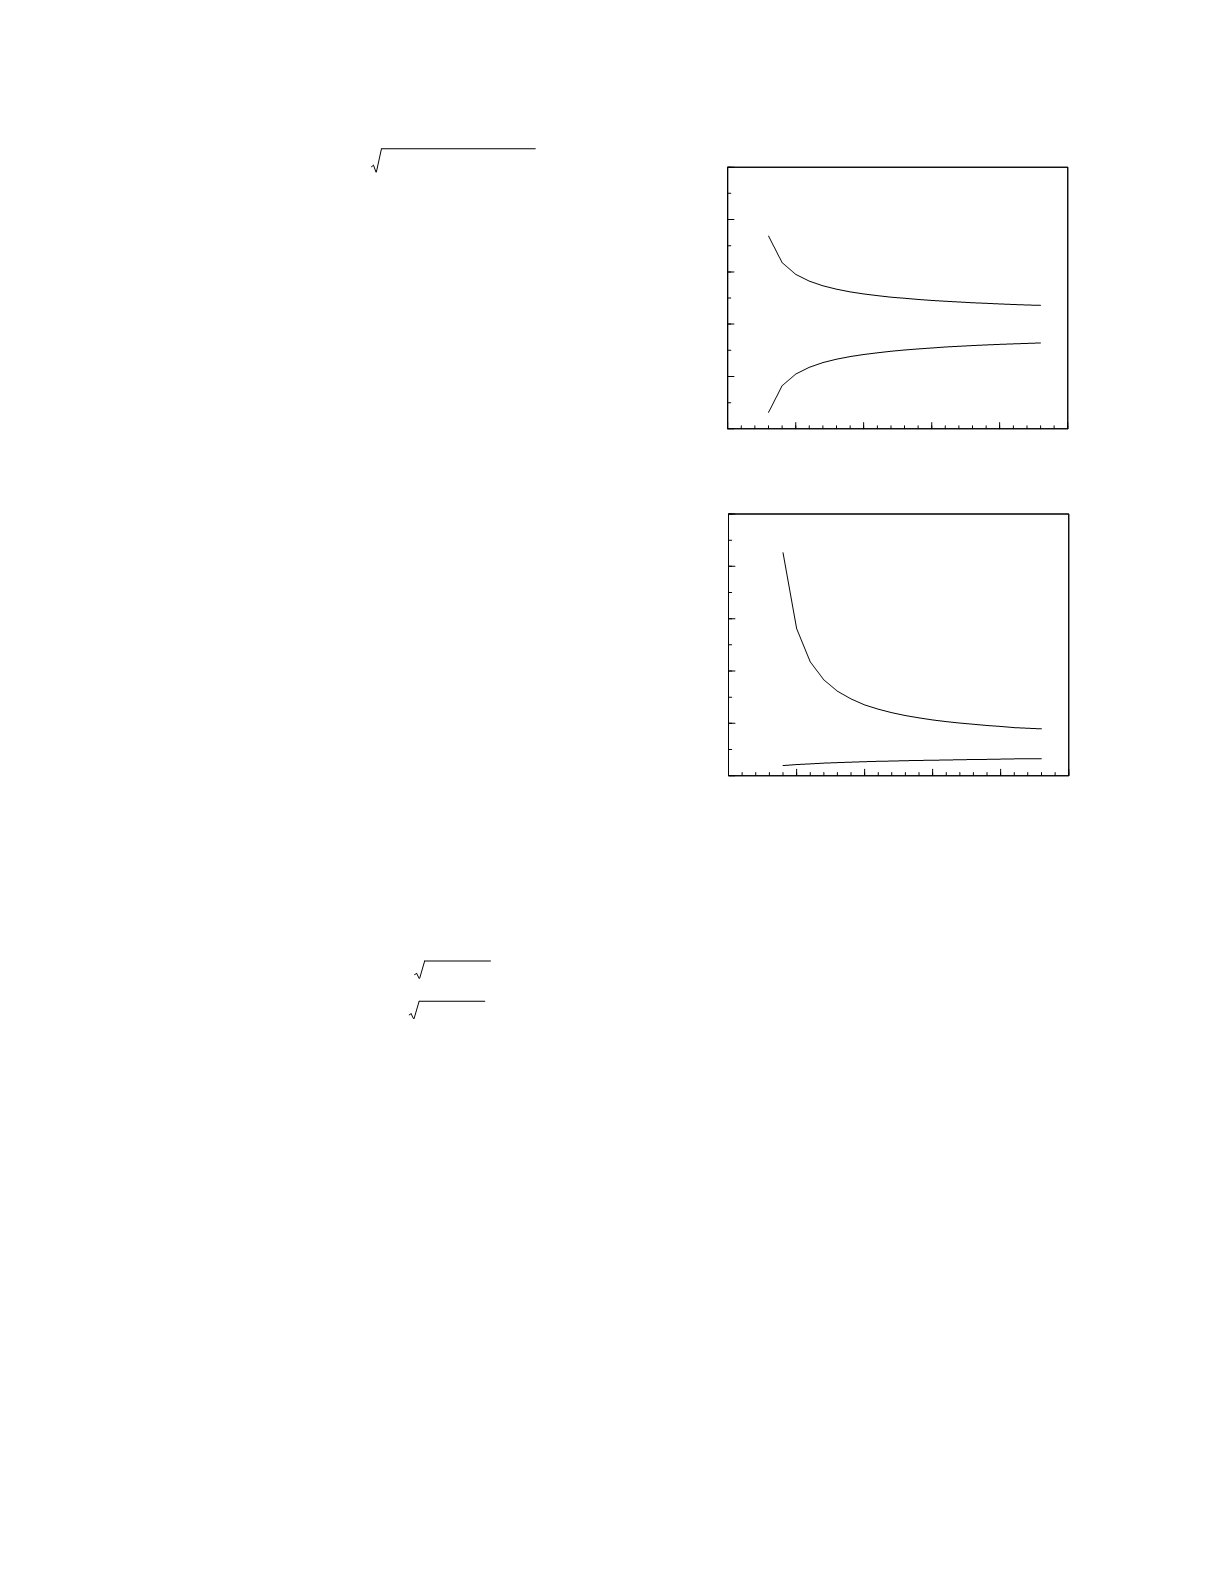
This is illustrated in the lower graph in Figure 5.5.
The 5th and 95th percentile confidence limits for
estimates of the mean and the variance are shown.
For fewer than six measurements, the 90 percent
confidence interval for the variance is large, having
a width more than five times greater than the calcu-
lated variance. Notice that, with six or more previ-
ous study results, avg
indiv
can also be estimated with
acceptable certainty, the 90 percent confidence inter-
val being about 1.65 standard deviations in width.
Given a reliable estimate of var
indiv
, the formula
for a significant difference between study results can
be individualized when it is used to evaluate subse-
quent results. However, a more sensitive way to
detect a change in marker concentration is to
compare subsequent study results with the distribu-
tion of results in the patient as based upon estimates
of avg
indiv
and var
indiv
. Setting the specificity at 0.95,
a change in concentration is indicated if a result is
outside the central 95 percent range of preceding
marker concentrations,
significant result
m
avg
indiv
+
2
var
indiv
or
[
avg
indiv
−
2
var
indiv
This approach is more sensitive because it incorpo-
rates more of the prior information known about the
patient
avg
indiv
as well as var
indiv
.
Monitoring rules
Because monitoring studies are typically
performed on a more or less regular schedule, there
are usually a number of opportunities to evaluate
study results following a change in physiologic
status. This means that the ability to detect a change
in status will be improved because the chances that
at least one of the monitoring results will indicate a
significant change in marker concentration increases
with the number of measurements. However, as the
sensitivity to detect a change in concentration
increases, the specificity declines. For instance, as
presented, the preceding formula for identifying a
significant change in marker concentration has a
specificity of 0.95. Were this formula to be used in
serial monitoring, the specificity would decline
which each study repetition,
.
specificity of n measurements
=
0.95
n
After two determinations, the specificity would be
0.90 and after five determinations it would be 0.77.
Clearly the repetitive use of this formula is not
acceptable as a monitoring rule.
A number of candidate clinical monitoring rules
can be found among the quality control rules used in
the clinical laboratory. The 1
3s
quality control rule,
for instance, which stipulates that a monitoring study
result must be greater than 3 standard deviations
different from the preceding average value to be
significant, gives a single study specificity of 0.998
Monitoring
5-6
0
5
10
15
20
25
Number of measurements
-2
-1
0
1
2
3
Multiples of the SD
0
5
10
15
20
25
Number of measurements
0
2
4
6
8
10
Multiples of the variance
variance
mean
Figure 5.5
The 5th and 95th percentile confidence limits for
estimates of the mean and variance as a function of the
number of measurements used to calculate the estimates.
The limits for the estimate of the mean are expressed in
terms of the standard deviation with the estimate located at
the origin. The limits for the estimate of the variance are
expressed in terms of the variance with the estimate located
at 1.


