scatterplot smoothing or it can be modeled paramet-
rically by fitting the trend of the data to a line or
higher order polynomial (Royston 1991) using
regression analysis. The curves defining the limits
of the frequency distribution are constructed by
modeling the scatter of the data around the curve
that defines the mean values (Royston 1991, Wright
and Royston 1997). A useful way to present a
modeled frequency distribution is as a nomogram. It
is much easier to determine a numerical value from a
nomogram than it is from a graph, even if the graph
is well-drawn and the curves have simple shapes.
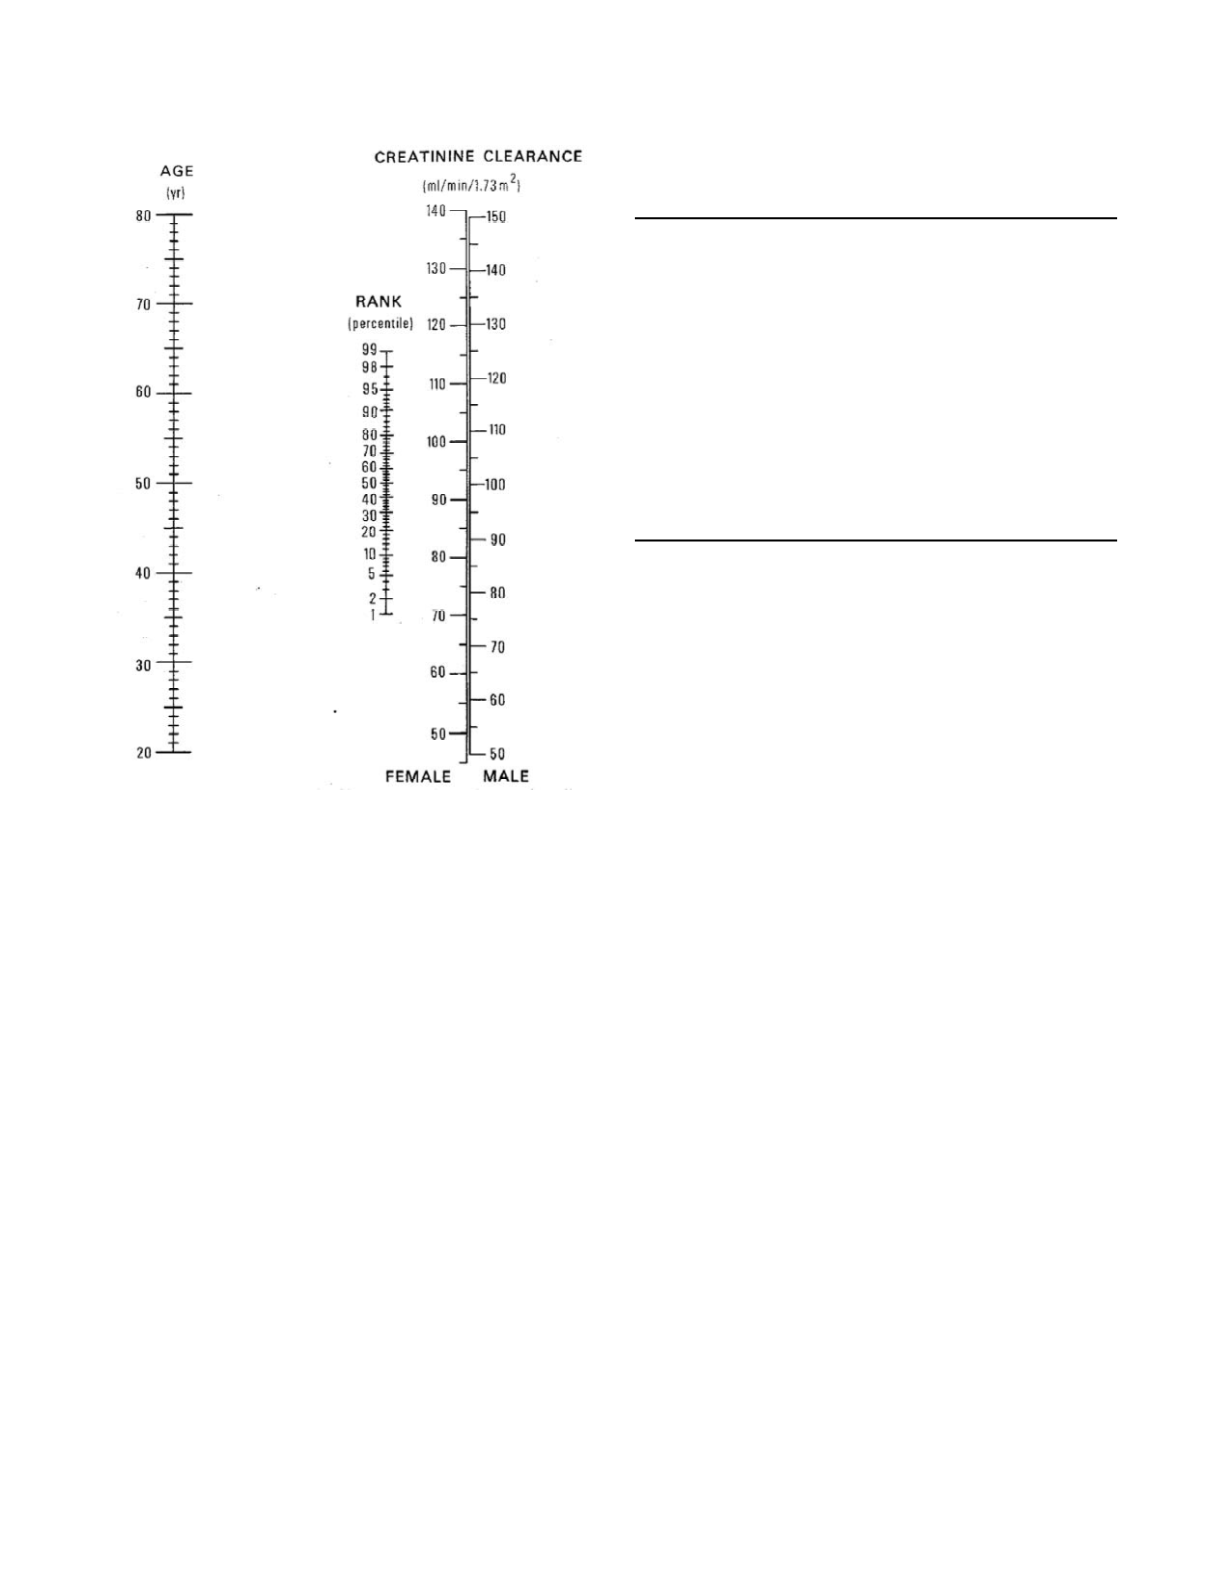
An example of a frequency distribution presented as
a nomogram is found in a report by Rowe
et al.
(1976b) describing the relationship between age and
creatinine clearance rate in adults. The nomogram,
shown in Figure 6.4, is based on the following linear
model of mean clearance rate and constant model of
clearance rate standard deviation,
mean creatinine clearance rate (ml/min/1.73 m
2
) =
133 - 0.64 age (in years)
and
standard deviation = 15 ml/min/1.73 m
2
for males. Creatinine clearance rates in females
equal 0.93 times the value in age-matched males.
SEX
Sex-based heterogeneity in laboratory study
results arises in three ways. First, the concentra-
tions of sex organ-specific marker substances differ
between the sexes. Most notably, prostatic acid
phosphatase and prostate-specific antigen, which are
moderately specific for the prostate, are present in
only low concentrations in the plasma of females.
Second, beginning at puberty, the plasma concentra-
tions of the sex hormones and sex hormone-binding
plasma proteins differ between the sexes. Third,
also starting at puberty, secondary sexual differences
in body composition and differences in various sex
hormone-influenced aspects of metabolism cause the
frequency distributions of many laboratory study
results to differ between the sexes.
In addition to listing separate sex hormone refer-
ence frequency ranges for adult males and females,
the sex-specific reference frequency distributions for
the analytes listed in Table 6.1 are used at either the
Massachusetts General Hospital (Jordan
et al.
1992)
or the Johns Hopkins Hospital (Noe and Rock 1994).
Pregnancy
Pregnancy has profound effects upon a woman’s
physiology and metabolism resulting in numerous
alterations in laboratory study results (Young 1979).
Biologic Variability
6-4
Table 6.1
Laboratory analytes with sex-based reference
frequency distributions
M > F
Alanine aminotransferase
Alkaline phosphatase
Aspartate aminotransferase
Creatine kinase
Creatinine
Ferritin
Hematocrit
Hemoglobin
Uric acid
F > M
Aldosterone
(Erythrocyte) sedimentation rate
Figure 6.4
Nomogram for the determination of age-based
percentile rank of creatinine clearance rate. Reprinted from
Rowe JW, Andres R, Tobin JD, Nomis AH, and Shock NW.
1976. Age-adjusted standards for creatinine clearance. Ann
Intern Med 84:567.


