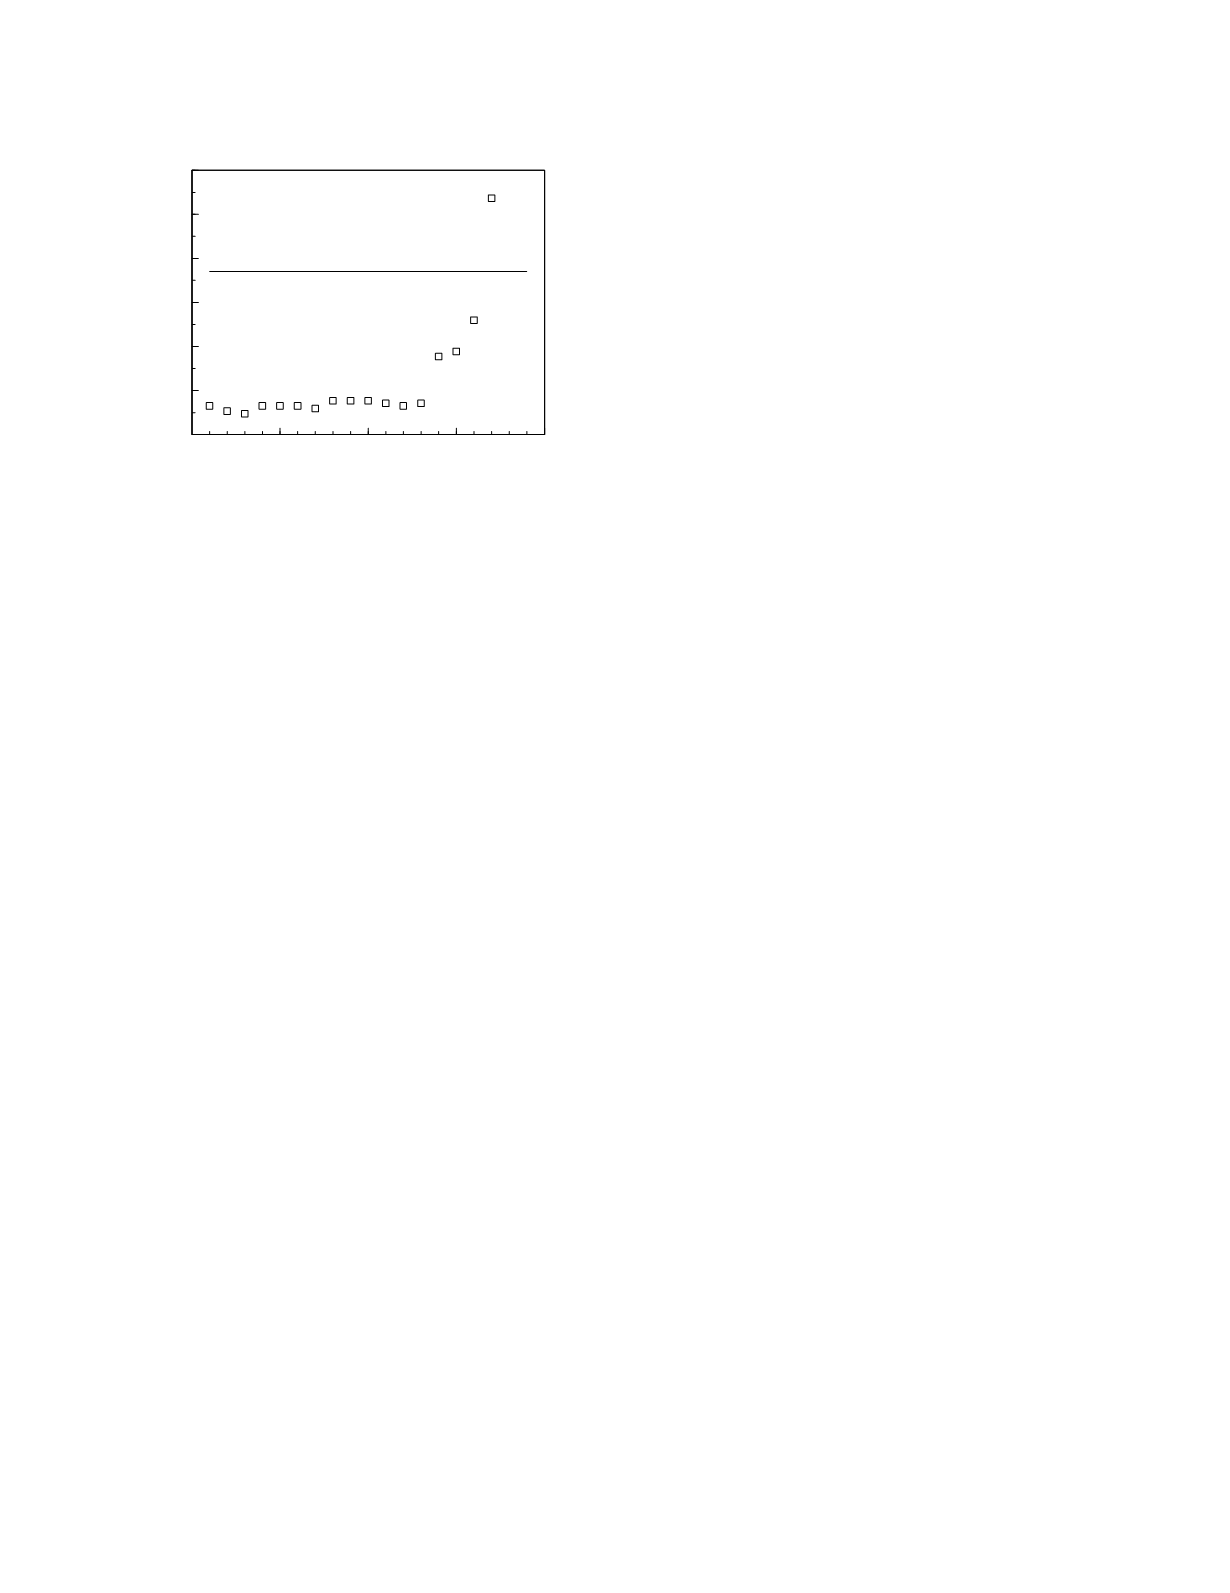
the earliest demonstration of the increase in CEA
concentration was achieved by the 1
3s
rule. This rule
gave a significant result 4 months prior to the clini-
cal appearance of the tumor recurrence and 3 months
prior to obtaining a significant result based on the
population-based critical value. Thus, for this
patient, the 1
3s
rule performed very well and would
have allowed for the earliest treatment of the
recurrence.
MONITORING THERAPEUTIC RESPONSE
The purpose of monitoring therapeutic response
is to determine if the expected benefit has been
obtained from a therapeutic maneuver and to gauge
the magnitude or risk of any unwanted effects from
the maneuver. Clinical observations may provide all
the information needed to assess the efficacy and
toxicity of medical therapy but, often, laboratory
studies are needed to supplement the clinical obser-
vations. Indeed, sometimes there are no overt clini-
cal findings that correlate in a timely fashion with
the effects of therapy, in which case laboratory
findings are the only useful measure of therapeutic
response.
Medical intervention is instituted with the inten-
tion of curing a disorder or decreasing the intensity
or extent of the disorder. Therefore, markers of the
level of activity of a disorder, if available, are
particularly suitable as tools for therapeutic monitor-
ing. Indirect measures of disease activity, such as
organ functional state or metabolic status, can also
be highly reliable indices when monitoring therapy.
An example is monitoring the reticulocyte count to
evaluate the effect of treatment of iron deficiency
anemia with iron. The evidence of successful
therapy is apparent within days when this measure of
marrow generative function is used.
Sometimes neither direct nor indirect laboratory
markers of disease activity are available. In such a
circumstance, it may be possible to use a measure of
therapeutic intensity as a predictor of therapeutic
response. This situation arises not infrequently in
drug therapy, especially with drugs that are used to
control episodic clinical conditions such as epilepsy.
This kind of monitoring, called therapeutic drug
monitoring, is discussed in a later chapter.
Timing of monitoring studies
Therapeutic monitoring using direct or indirect
measures of disease activity should be performed at
those times following the institution of therapy that
most reliably indicate the response of the marker to
the therapy. For the example of monitoring iron
therapy in iron deficiency anemia, if one uses the
reticulocyte count, the maximal response is seen
days after beginning therapy so this is the best time
to perform the study. If one uses the blood
hemoglobin concentration to monitor iron therapy, a
3 mmol/L (2 g/dl) increment requires approximately
3 weeks, so monitoring with this criterion calls for a
study at 3 weeks. If the restoration of a normal
hemoglobin concentration is the monitoring
criterion, a hemoglobin determination should be
performed at 6 weeks. Individually none of these
monitoring schemes is fully satisfactory. If one
looks only for an initial reticulocyte response to iron
therapy, later evidence of coexistent vitamin
deficiency or other complicating factors will be
missed entirely. If one only looks for the final resto-
ration of a normal hemoglobin concentration, one
will miss early evidence of an incorrect diagnosis of
iron deficiency. The optimal monitoring strategy
here, and generally, consists of a combination of
monitoring studies; rapidly responsive markers
measured early on to assess the immediate impact of
therapy and definitive markers measured after the
new physiologic steady-state is achieved to deter-
mine if that steady-state is the one expected in
response to therapy. If therapy is meant to maintain
an altered physiologic state for an extended time,
periodic monitoring of the state is also desirable.
The timing and frequency of periodic monitoring
depends upon many considerations including the
therapeutic schedule, the time course of marker
Monitoring
5-8
0
5
10
15
20
Time (months)
0
2
4
6
8
10
12
CEA (µg/L)
population-based
critical value
Figure 5.6
Postoperative plasma CEA concentrations in a
patient with breast cancer. Data from Winkel
et al.
(1982).


