average of
n
1
and
n
2
, and
SD
1
and
SD
2
are the
standard deviations of the frequency distributions for
the first and second subgroups, respectively. These
rules apply only to subgroup distributions that are
normally distributed and those that after transforma-
tion are normally distributed.
A problem with these rules is that they do not
arise from an explicit underlying diagnostic perform-
ance criterion. One criterion that could be suggested
is the magnitude of the difference in likelihood ratios
between the subgroup frequency distributions at
some specified study value. A study value that
yields a specificity of 0.95 in one of the subgroup
frequency distributions seems a good choice
because, as mentioned previously, such a value
would likely be within the range of values most
relevant to the making of diagnostic decisions based
on the study results. In order to test the frequency
distributions at both tails, the criterion must also
include evaluation of the likelihood ratio difference
at a study value that yields a specificity of 0.05. A
graphical test for this two-tail criterion is illustrated
in Figure 6.2 for a threshold value of a 3-fold differ-
ence in likelihood ratios. As with Harris and Boyd’s
rules, the graphical test is valid only when the
subgroup frequency distributions are normally
distributed or can both be transformed to yield
normal distributions. Unlike Harris and Boyd’s
rules, however, the criterion can also be applied in a
nonparametric fashion to subgroup frequency distri-
butions having any shape. Simply determine the
study values that yield a specificity of 0.95 and 0.05
in one of the subgroup frequency distributions and
calculate the ratios of the frequencies associated with
the respective study values in the two subgroups,
using the larger frequencies as the numerators.
Those ratios equal the multiplicative differences in
the likelihood ratios at the two tails of the frequency
distributions. If both of the ratios are less than 3,
the frequency distribution for the combined popula-
tion should be used; if the either ratio is greater than
3, subgroup frequency distributions should be used.
Biologic Variability
6-2
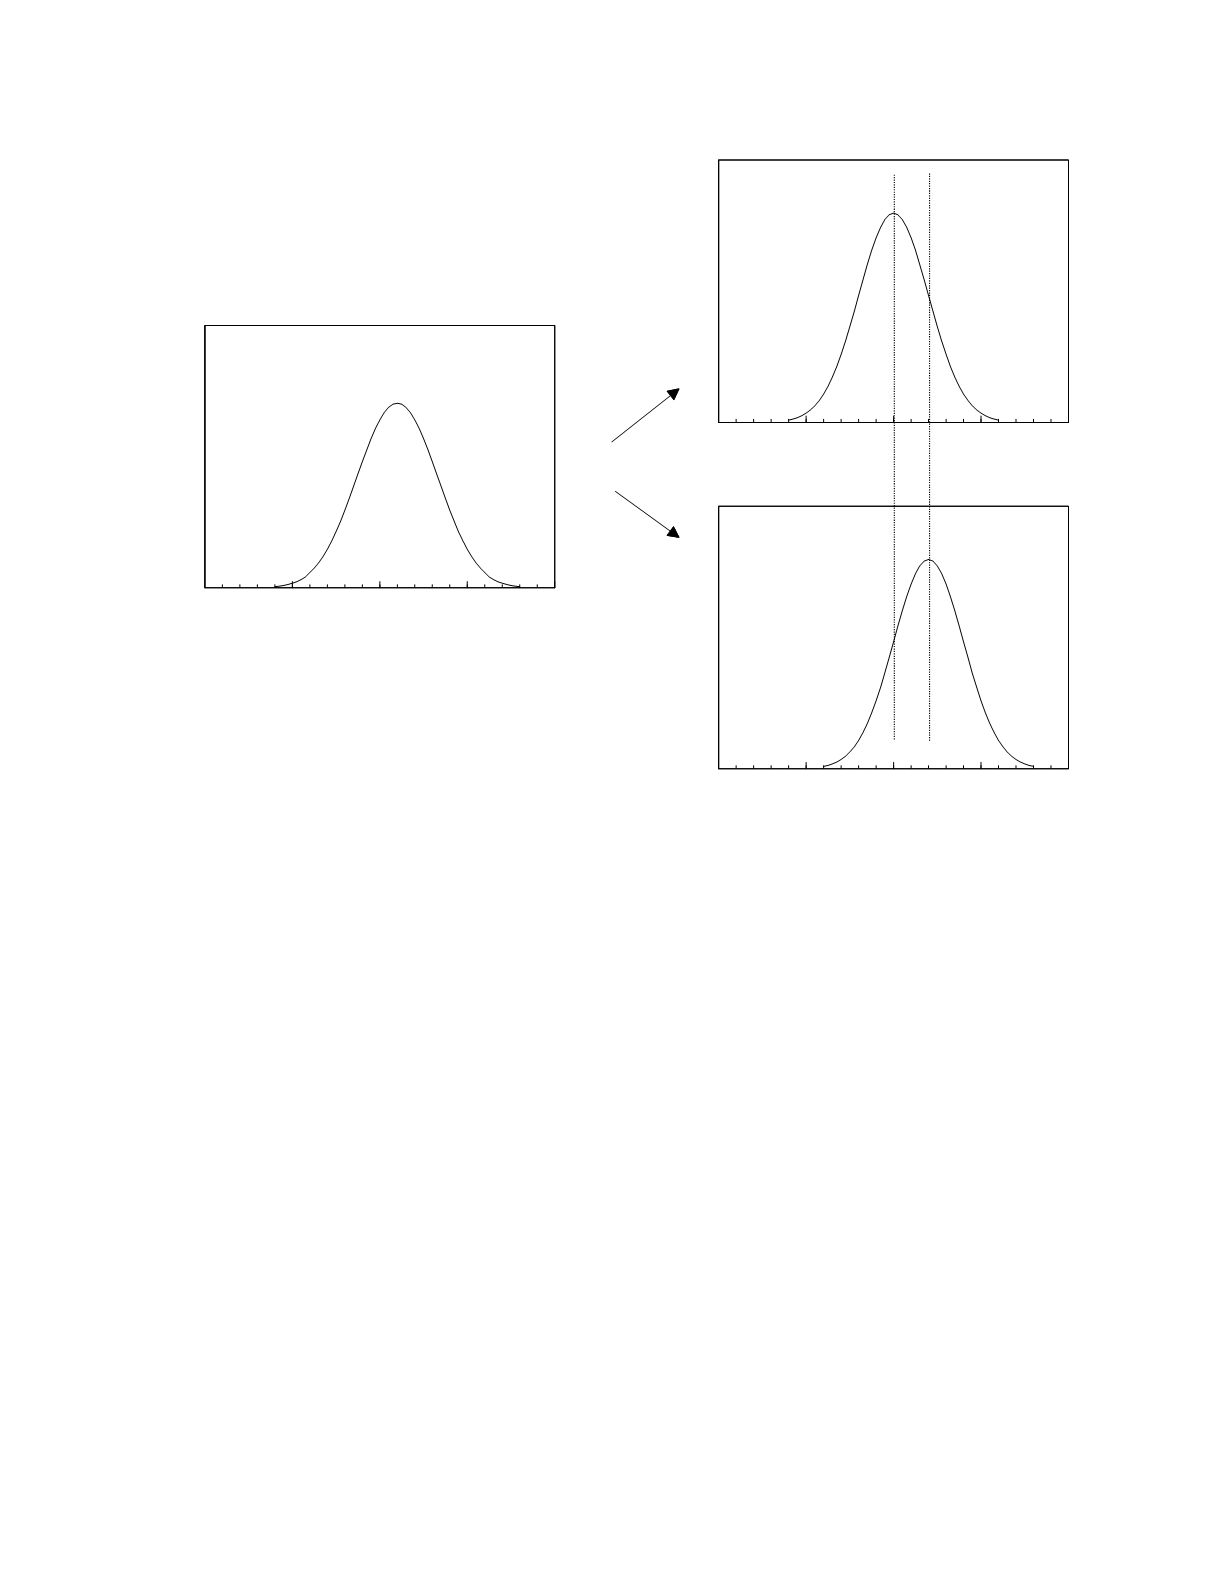
Figure 6.1
The hypothetical frequency distribution of a two subgroup population (left) and the frequency distributions of its
constituent subgroups (right). The subgroups are equal in size and are normally distributed with the indicated means and
standard distributions. The mean and standard deviation of the combined population, which is not normally distributed, is
also indicated. The standard deviation of the combined population is only 12 percent larger than the standard deviations of
the constituent subgroups.
0
50
100
150
200
Study value
Frequency
0
50
100
150
200
0
50
100
150
200
mean 110
SD 22.4
mean 100
SD 20.0
mean 120
SD 20.0


